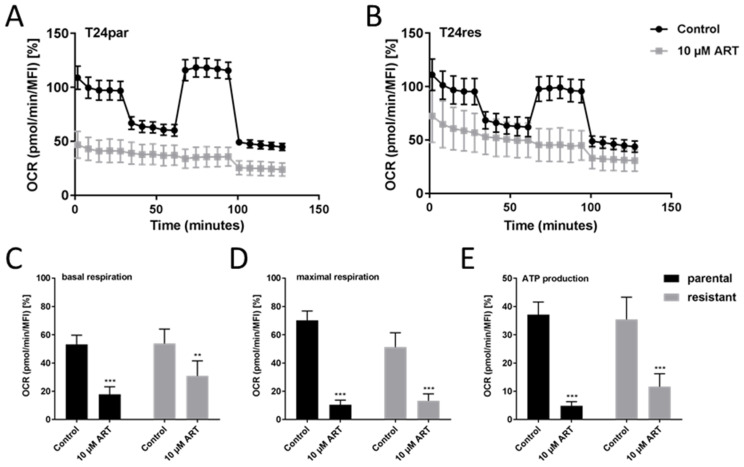
Figure 5.
Mitochondrial respiration: Mitochondrial respiration in parental (A) and resistant (B) T24 cells, 24 h exposed to ART, compared to untreated controls. Data pertaining to the OCR were normalized to total basal respiration (set to 100%) consisting of mitochondrial and non-mitochondrial respiration. Extracted values for mitochondrial basal OCR (C) and maximal OCR (D) and ATP production (E) after ART treatment. MFI = mean fluorescent intensity. Error bars indicate standard deviation (SD). Significant difference to untreated control: ** p ≤ 0.01, *** p ≤ 0.001. n = 3.

