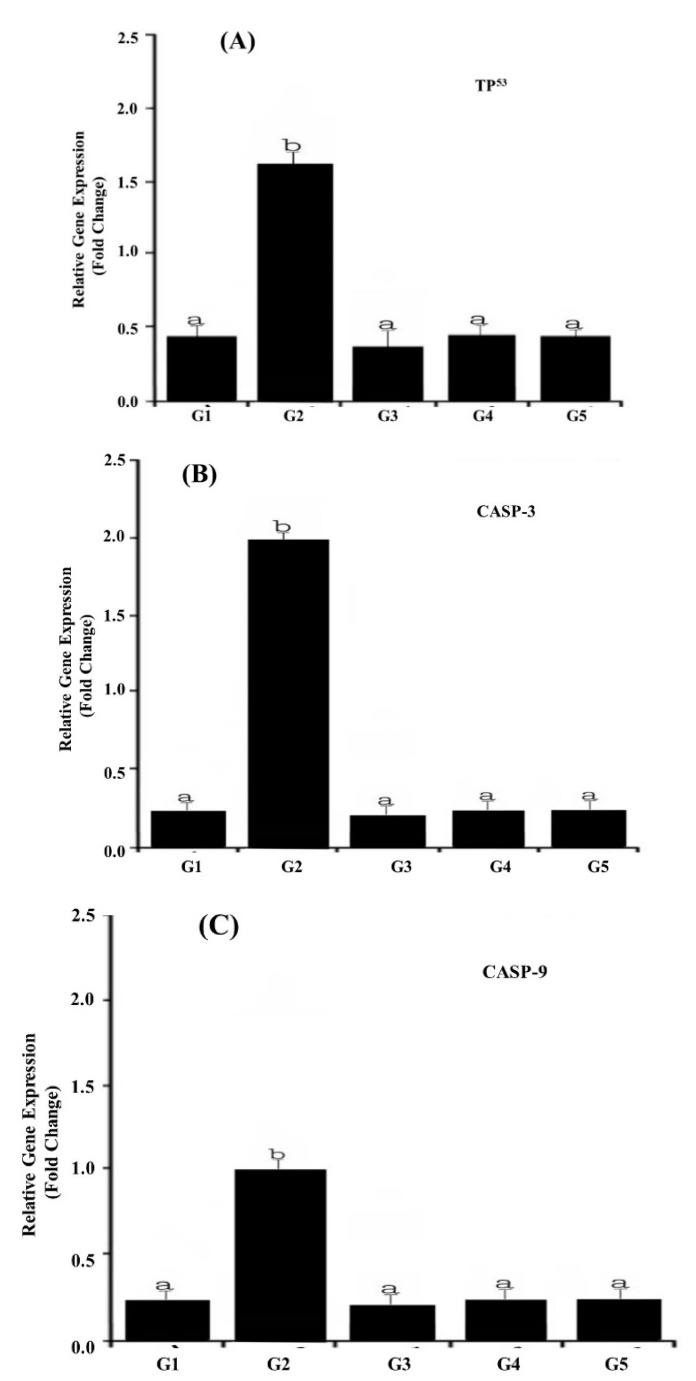
Figure 2.
LightCycler®480 real-time PCR analysis of apoptosis-related genes in TZ-ingested rats and Nano-CUR ingested rats. The PCR analysis was performed using isolated and reverse transcribed RNA with primers listed in Table 4. CASP-2 methods were applied for relative expression determination using PCR efficiencies, which were determined with the standard curve of each run. The data point denotes the results obtained from three individual batches of cDNA made for each stage or tissue (A) TP53 gene expressions, (B) CASP-3 gene expression, and (C) CASP-9 gene expression of target genes, which were normalized to the reference glyceraldehyde-3-phosphate dehydrogenase (GAPDH) gene and indicated as mean ± S.E. The different alphabet letters specify different mean values at p < 0.05 by a paired Student t-test.

