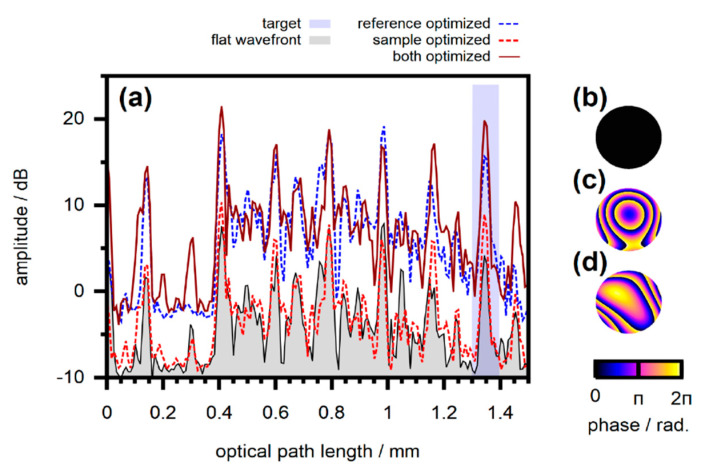
Figure 12.
Adaptive optics correction and enhancement of OCT signal. (a) OCT A-scans taken at the sample with different phase patterns applied. The depth-range from which the feedback signal for wavefront optimization is calculated is highlighted (light blue area). (b) Flat wavefront applied to both beams for the acquisition of the initial scan (signal marked by grey area). The pattern applied corresponds to a beam diameter of 4 mm at the SLM. (c,d) Wavefronts optimized at the sample beam and reference beam, respectively. Image adapted from [8,101], with permission. The signal enhancement obtained is clearly visible.

