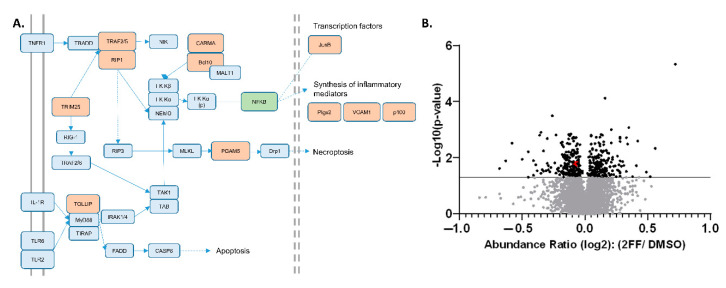
Figure 2.
Significantly decreasing proteins associated with NF-κB and TNF pathways. (A) Pathway analysis; significantly decreased proteins are shown in orange (see Supplemental Figures S1–S3 for source KEGG pathways). (B) Volcano plot of over 5000 proteins quantified in the global proteomics experiment. Black points above the solid line indicate proteins with abundance ratio p-values ≤ 0.05; with Tollip and Bcl10 are highlighted (red dots, overlapping).

