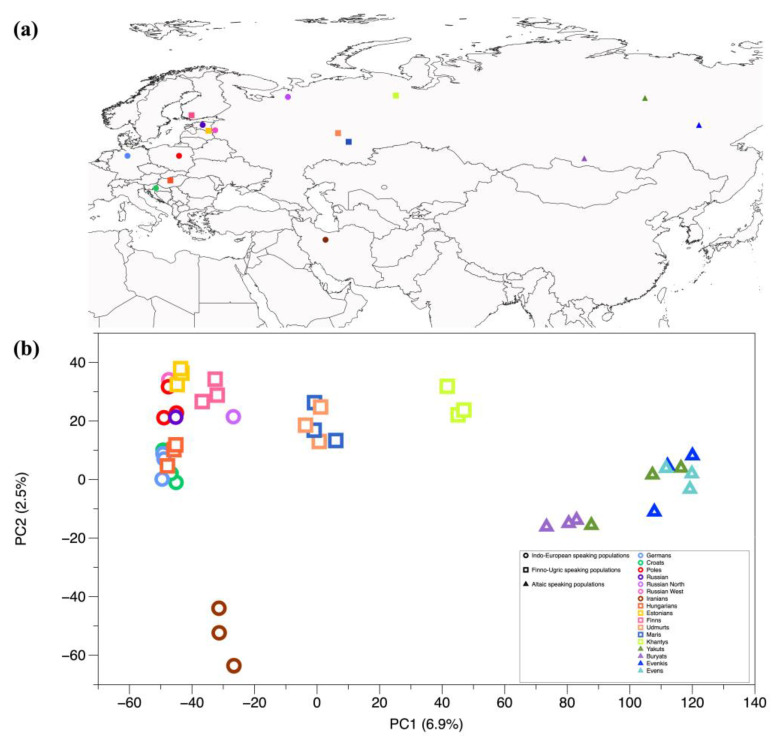
Figure 3.
Geographical locations and Principal Component Analysis (PCA) of genomic variation. Populations speaking an IE, FU and AL language are represented by circles, squares and triangles, respectively. (a) Geographical locations of the samples in this study. (b) Projection on two dimensions of the main components (PCA) of genomic variation in IE, FU and AL speaking populations.

