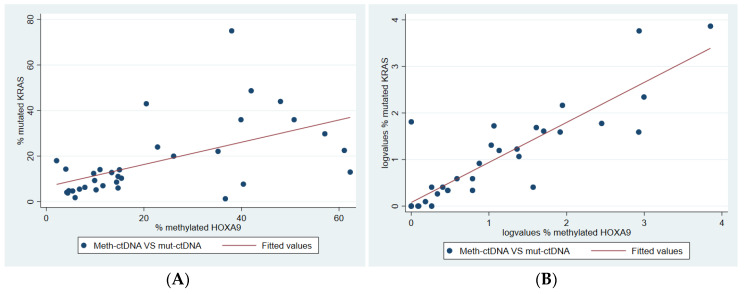
Figure 3.
Correlation between methylated Homeobox A9 (meth-HOXA9) and mutated Kirsten rat sarcoma viral oncogene homolog (mut-KRAS). Two-way scatter plot of (A) tumor meth-HOXA9 percentages plotted against mut-KRAS percentages and a trend line and (B) plasma meth-HOXA9 percentages plotted against the mut-KRAS percentages (both log-transformed) with a trend line.

