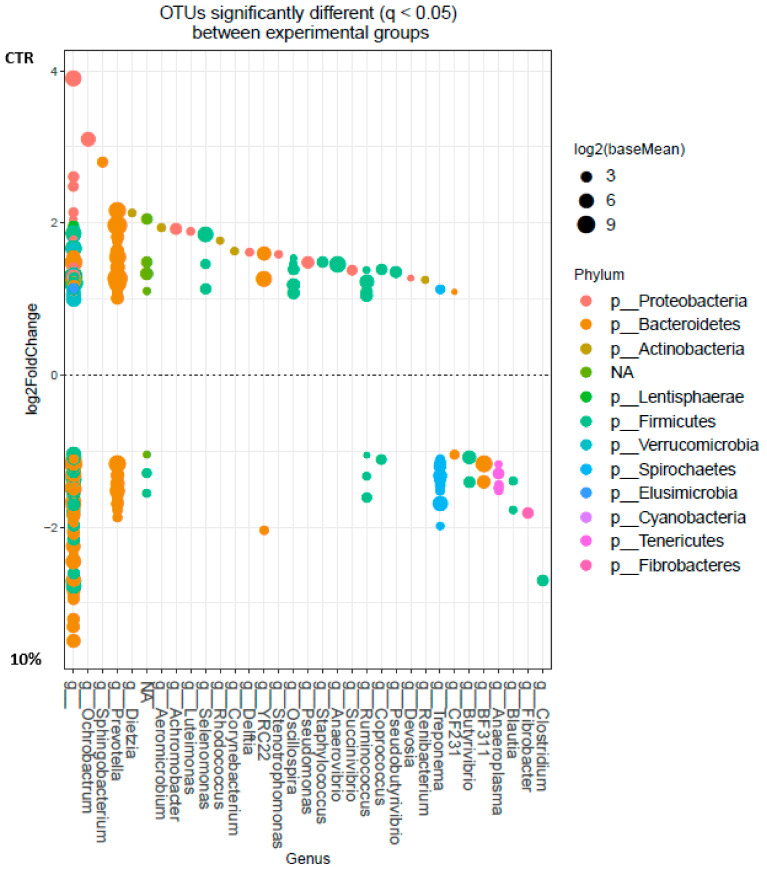
Figure 4.
Operational Taxonomic Unit (OTU) at genus level significantly different (q < 0.05) between rumen samples of sheep fed control (above; n = 8) and concentrate with 100 g/kg of SCG (10%, below; n = 9). Each point represents a single OTU coloured by phylum and grouped on the x-axis by taxonomy, size of point reflects the log2 mean abundance of the sequence data.

