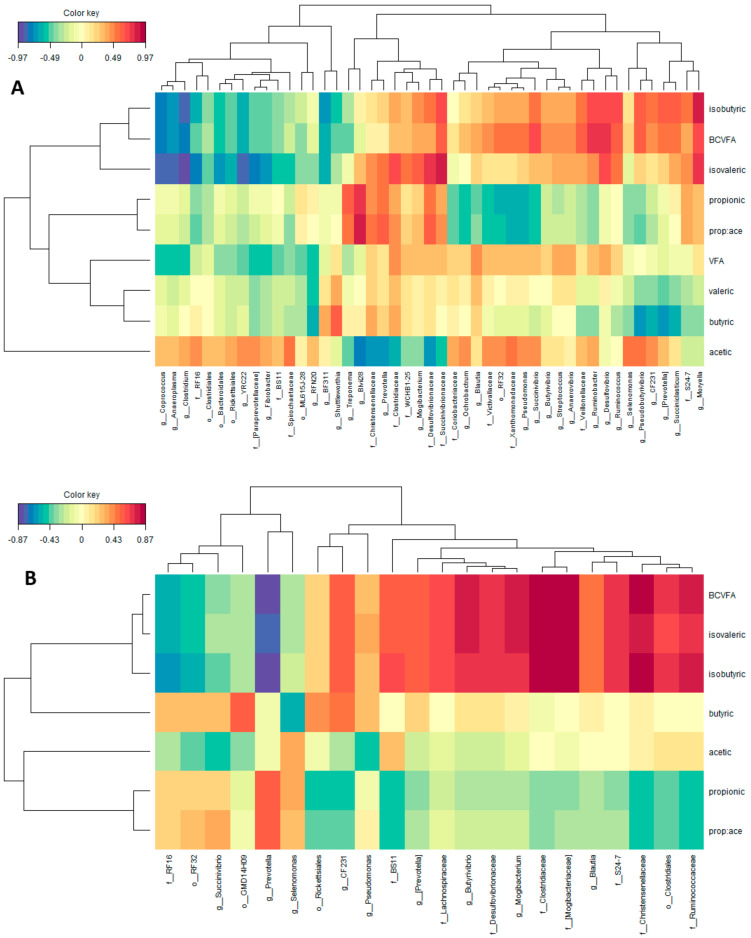
Figure 6.
Relationships between clusters of bacterial genus and rumen VFA proportions in the Control group (A; n = 8) and in the groups fed SCG at different doses (B; n = 27). This clustered image map was based on the regularized canonical correlations between relative bacterial abundances and relative concentrations of rumen volatile fatty acids. Significant correlations are coloured following the key shown.

