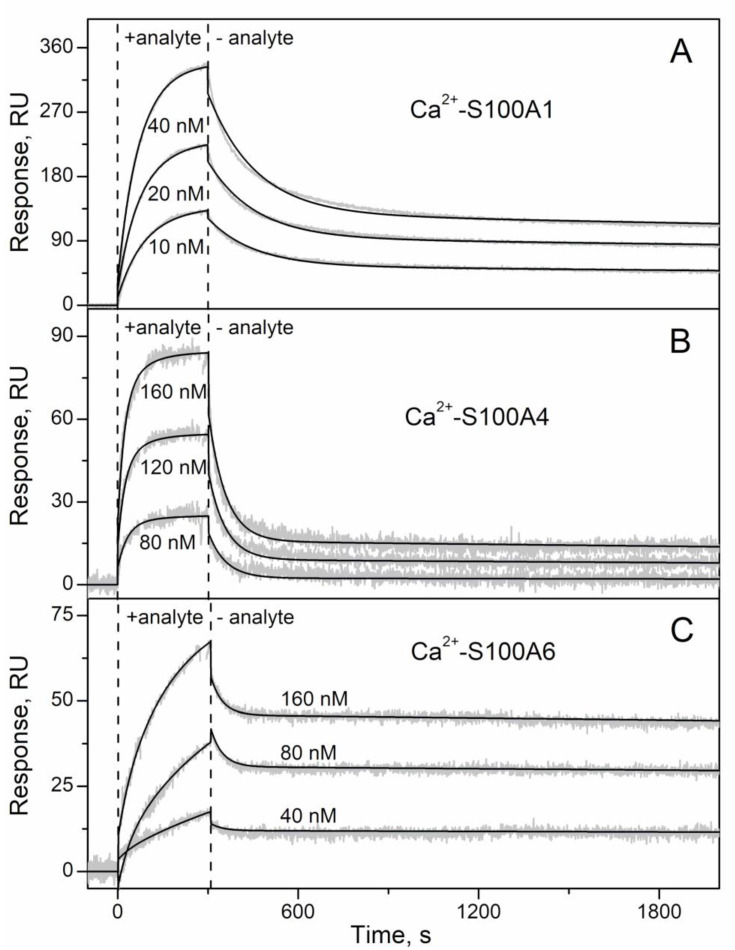
Figure 2.
Kinetics of the interaction between IFN-β- and Ca2+-bound S100 proteins at 25 °C (1 mM CaCl2, pH 7.4), monitored by SPR spectroscopy using IFN-β as a ligand and S100A1 (panel A), S100A4 (B) or S100A6 (C) as an analyte (0.25–5 µM). The sensograms for control experiments are also indicated: Ca2+-depleted S100 proteins (1 µM; 1 mM EDTA) were used as an analyte; IFN-α served as a ligand. Grey curves are experimental, while black curves are theoretical, calculated according to the heterogeneous ligand model [1] (refer to Table 1 for the fitting parameters).

