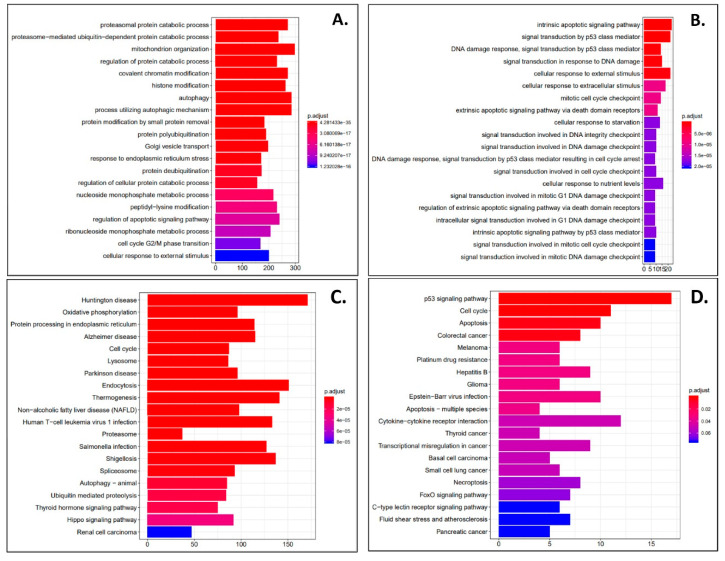
Figure 3.
Phenanthriplatin and cisplatin modulate cellular pathways in A549 cells. (A) The top 20 enriched GO biological processes for the A549 phenanthriplatin versus A549 control comparison. (B) The top 20 enriched GO biological processes for the A549 cisplatin versus A549 control comparison. (C) The top 20 enriched KEGG pathways for the A549 phenanthriplatin versus A549 control comparison. (D) The top 20 enriched KEGG pathways for the A549 cisplatin versus A549 control comparison. The x-axes show the number of DEGs per GO biological process. Statistical analysis for KEGG pathway analysis is provided in the panels.

