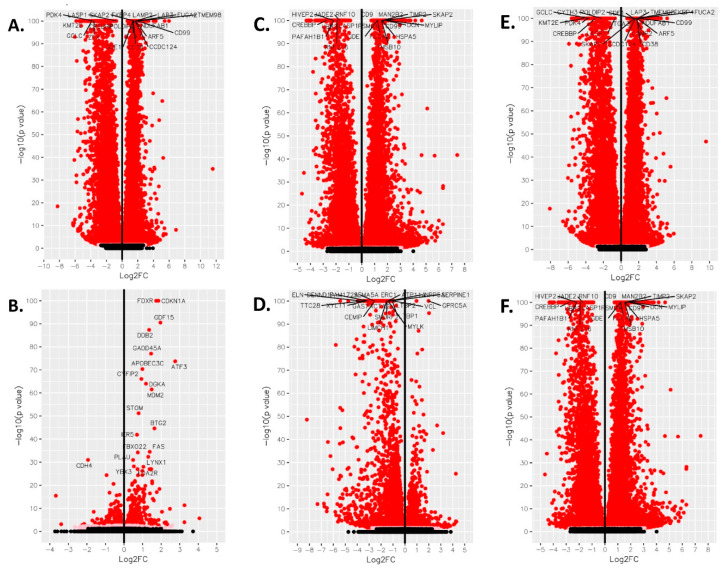
Figure 4.
Volcano plot analysis of phenanthriplatin and cisplatin modulation of cellular pathways in A549, IMR90, and between A549 and IMR90 cells. Volcano plot for (A) A549 phenanthriplatin vs. A549 control, (B) A549 cisplatin vs. A549 control, (C) IMR90 phenanthriplatin vs. IMR90 control, (D) IMR90 cisplatin vs. IMR90 control, (E) A549 phenanthriplatin versus A549 cisplatin, and (F) IMR90 phenanthriplatin versus IMR90 cisplatin treatments. Log2 fold change on the x-axis is plotted against –log10(p-value) on the y-axis. Key: filled black circle = not significant, filled pink circle = p value < 0.05, filled red circle = q value < 0.05.

