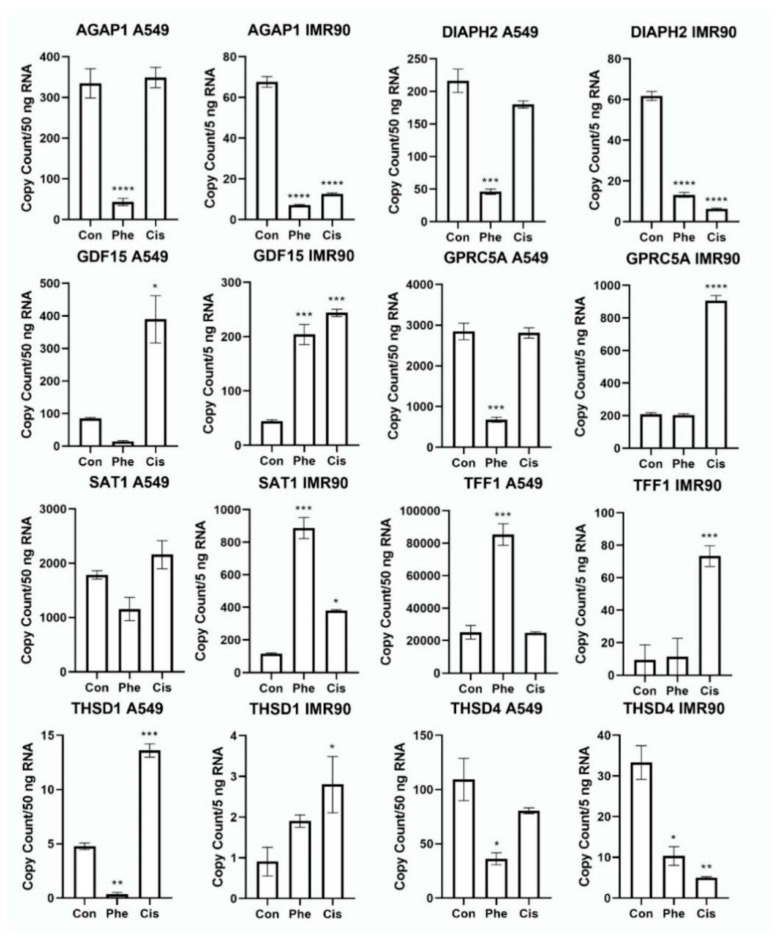
Figure 7.
Validation of select regulated genes identified by next generation sequencing using droplet digital polymerase chain reaction in A549 and IMR90 cells. Mean expression of the genes, AGAP1, DIAPH2, GDF15, GPRC5A, SAT1, TFF1, THSD1, THSD4, as measured by ddPCR. Graph labeling: Con = control; Phe = phenanthriplatin; Cis = cisplatin. Y-axis represents copy count for 50 ng RNA sample. Mean (± SEM); N = 3; p < 0.05; “*” = p < 0.05; “**” = p < 0.01; “***” = p < 0.001; “****” = p < 0.0001.

