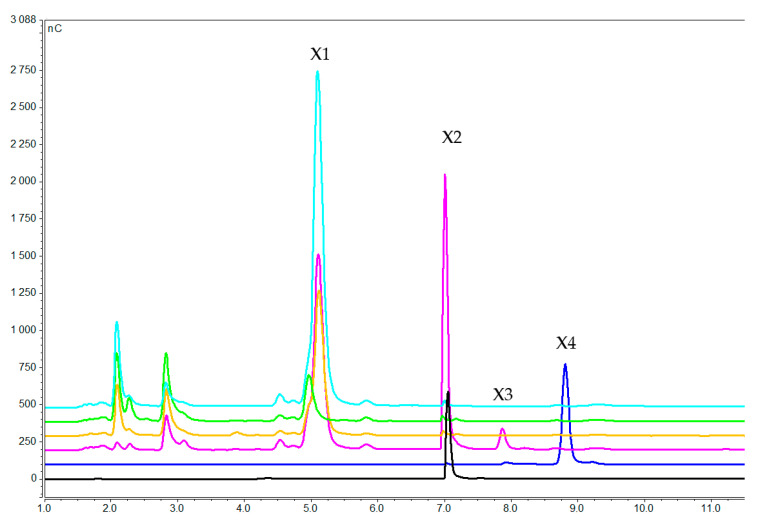
Figure 5.
Xylooligosaccharides concentration in the medium after 1 h (pink), 3 h (orange), and 7 h (green) of induction with xylotetraose. Blue, black and dark blue lines correspond to pure xylose, xylobiose and xylotetraose, respectively (X1 = xylose, X2 = xylobiose, X3 = xylotriose, X4 = xylotetraose).

