Figure 1.
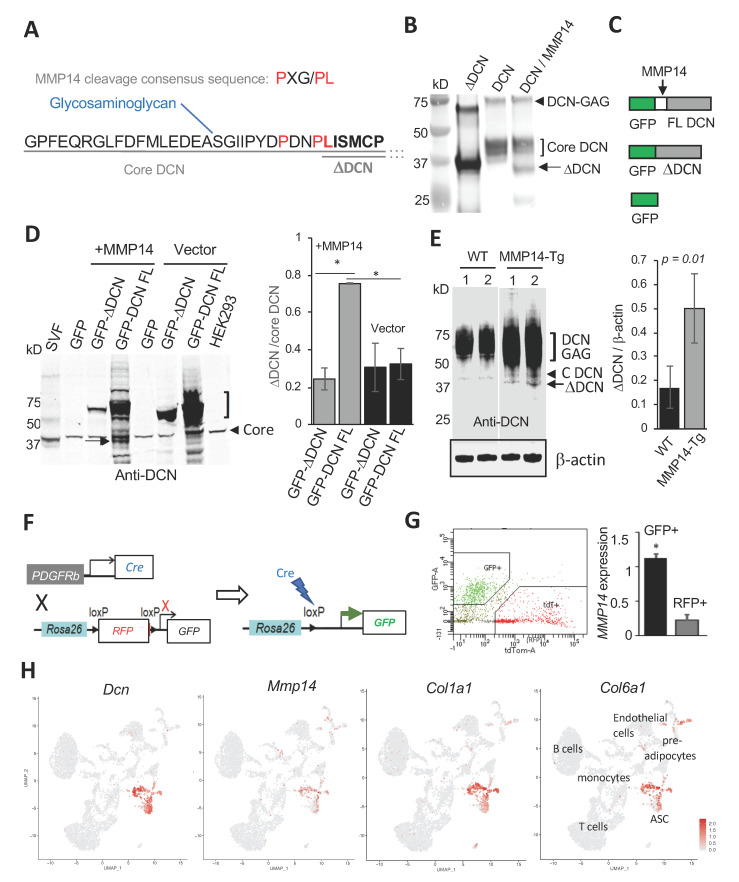
MMP14 is a protease generating a non-glycanated DCN isoform. (A) N-terminal sequence of mouse core DCN with downstream amino acid sequence abbreviated (…), showing serine-attached GAG and ΔDCN starting at leucine-45. The consensus MMP14 recognition motif is aligned above, showing matches (red). (B) ΔDCN (purified from bacteria) and full length (FL) DCN (purified from NS0 cells) were incubated with (+) or without (−) MMP14 for 30 min, resolved by 4–20% SDS-PAGE and subjected to anti-DCN immunoblotting showing cleavage of core DCN (bracket) and generation of ΔDCN (arrow). Arrowhead: glycanated DCN. (C) Recombinant GFP constructs expressed in HEK293 cells to test cleavage by MMP14. (D) Anti-DCN immunoblotting of extracts from HEK293 co-transfected with MMP14 and constructs shown in (C) reveals that ΔDCN (arrow) is induced by MMP14 expression. Note that ΔDCN-GFP is not cleaved. SVF (from mouse WAT): positive control for ΔDCN. HEK293 (non-transfected): negative control for ΔDCN. Bracket: glycanated DCN. Endogenous core DCN detected in all cells is used for normalization (graph). N = 3 independent transfections; * p < 0.01 (Student’s t-test). (E) Anti-DCN immunoblotting of extracts from WAT demonstrates higher ΔDCN (arrow) production in MMP14-overexpressing mice, compared to WT mice (N = 5 mice per group), for which only core glycanated (DCN-GAG) and core DCN (arrowhead) is detected. 1 and 2: separate littermates. Anti-β-actin immunoblotting: loading control used for normalization (graph). (F) A scheme for lineage tracing in the progeny of the cross between Pdgfrb-Cre and mTmG mice. Upon Cre expression and LoxP site recombination in Pdgfrb+ cells mT (membrane Tomato) is deleted and RFP is indelibly replaced by membrane GFP expression. (G) Isolation of GFP+ and RFP+ cells by FACS from WAT of Pdgfrb-Cre; mTmG mice and their RT-PCR analysis, which reveals high MMP14 mRNA expression in ASC identified as mG+ cells (Pdgfrb+ lineage). N = 5 independent samples. * p < 0.05 (Student’s t-test) compared to mT+ cells. The RT-PCR data are normalized to 18S RNA. (H) ScRNA-seq analysis of gene expression in Uniform Manifold Approximation and Projection (UMAP) plots showing clusters of cells identified. Note co-expression of Dcn, Mmp14, Col1a1, and Col6a1 in ASC.

