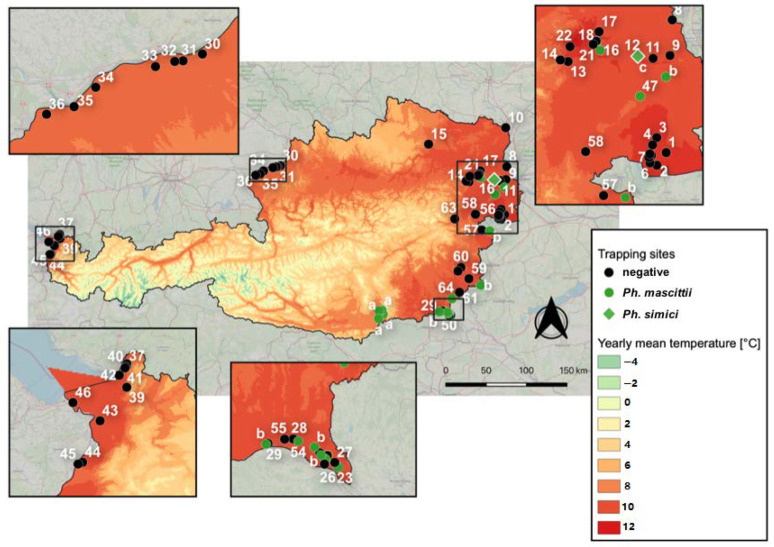
Figure 1.
Distribution map of all published Ph. mascittii and Ph. simici records in Austria including all surveyed locations presented in this study. The climate map of Austria shows mean annual temperatures (1971–2000). Locations sampled within this study are marked with digits (Table S1), prior published records are marked with letters, (a) Naucke et al. 2011 [5], (b) Poeppl et al. 2013 [6], (c) Kniha et al. 2020 [9].

