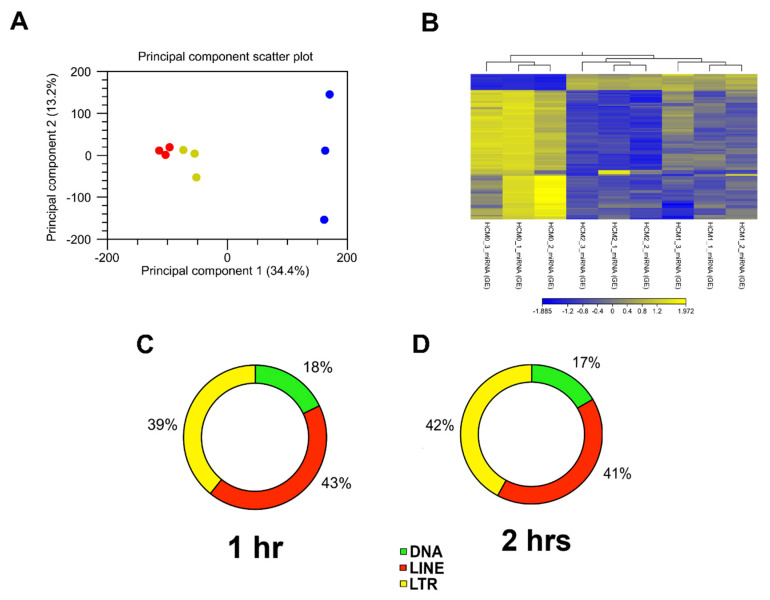
Figure 1.
Analysis of RNA-seq data and putative piRNAs induced by T. cruzi mapped to different transposable element subfamilies. (A) Principal component analysis (PCA) of gene expression was performed for all samples and all probe sets, by using a median centering of the data set. The x-axis corresponds to principal component 1 (PC1) and the y-axis to the principal component 2 (PC2); the percentage of the variance is indicated between brackets. Based on their small non-coding RNA expression values, samples from each time point (0, 1 and 2 h) clustered together, confirming homogeneity of the gene expression profiles within each group. The group of T. cruzi challenged samples clustered independently of the control group (blue = 0 h, yellow = 1 h, red = 2 h). (B) Heatmap and hierarchical clustering was performed on control and test samples, 0, 1 and 2 h, respectively, using Euclidean distance measure and single linkage analysis. Each column represents one sample and each row represents one non-small coding RNA within the data set. The color-coded scale illustrating the relative expression after global normalization is indicated. Differentially expressed putative and known piRNAs induced post parasite challenge of PHCM at (C) 1 h and (D) 2 h, respectively, belong to different transposable element families.

