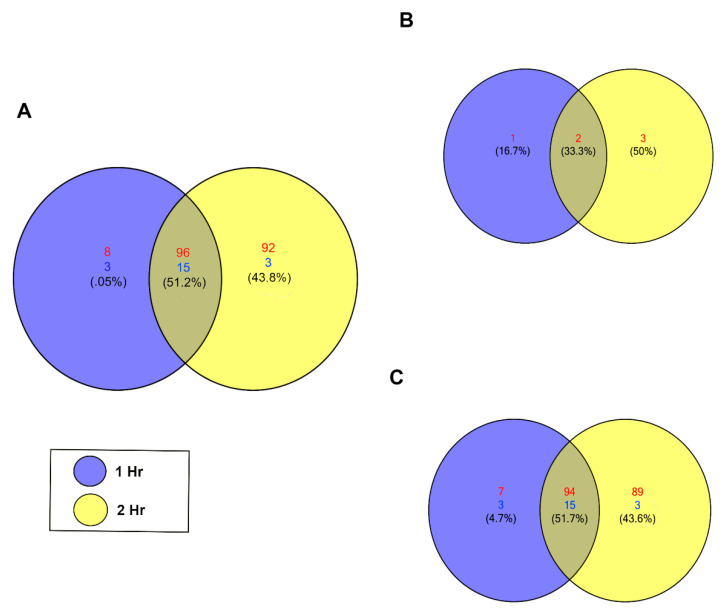
Figure 2.
T. cruzi induces differential expression of piRNAs in PHCM. (A) Venn diagram of upregulated and downregulated piRNAs counts at different time points after T. cruzi challenge of PHCM, FDR corrected p < 0.05. (B) Venn diagram generated showing the number of differentially expressed known piRNAs at 1 and 2 h post parasite challenge of PHCM. These previously reported and annotated piRNAs are available in the NCBI database. (C) Venn diagram showing distribution of putative piRNAs that were differentially expressed in PHCM at different time points after T. cruzi challenge. These piRNAs which were not previously published have now been deposited in the NCBI database.

