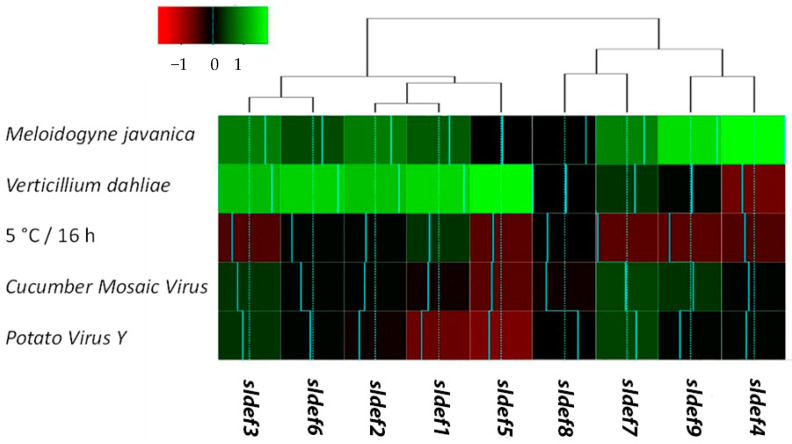
Figure 4.
Heat map of relative transcription for tomato defensin genes exposed to discrete biotic/abiotic stresses. Relative mRNA abundance was assessed by real-time RT-qPCR, employing three independent biological replicates. Data were standardized across treatments. Up-regulation is delimited with green color; down-regulation is designated with red color. Two major hierarchical clusters according to stimulus–response are denoted. Statistical analysis for the treatments presented here is provided in the Supporting information 6 figure. SlDef: Solanum lycopersicum defensin.

