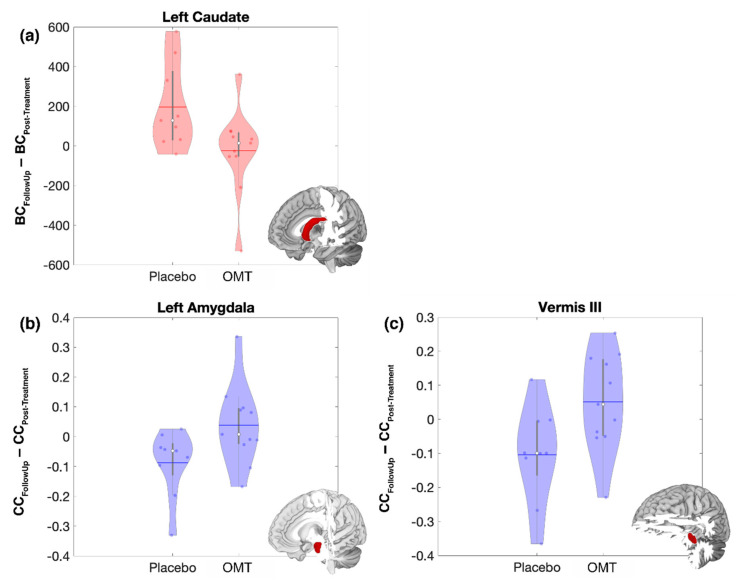
Figure 4.
Post-treatment to Follow-Up changes of brain functional topological measures in the Left Caudate (a), Left Amygdala (b) and in the Vermis III (c). Violin plots of the statistically significant difference between the follow-up and post-treatment values of Betweenness Centrality (BC, red) and Clustering Coefficient (CC, blue) for the Osteopathic Manipulative Treatment (OMT) and Placebo (P). The solid horizontal lines represent the mean of the distribution, while the white dots represent the median. For each plot the structural representation of the associated region is reported as the red portion of the whole brain (left Caudate, Left Amygdala and Vermis III respectively).

