Table 1.
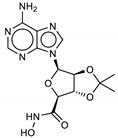
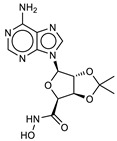
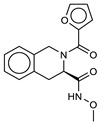
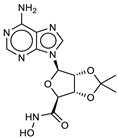
3D-QSAR: calculated free energies of binding by docking (ΔGB, in kcal/mol), pKi (docking structure-based) values, mean results (a consensus score as the average of the 3D-QSAR pIC50 and docking pKi values), and re-docking for the compounds with the best score.
| Compound/ID | Structure | 3D-QSAR pIC50 |
ΔGB | Docking pKi |
Mean | Re-Docking pKi |
|---|---|---|---|---|---|---|
|
1 ZINC5008970 |
|
6.3 | −9.2 | 6.8 | 6.5 | 6.6 |
|
2 ZINC5008966 |
|
6.1 | −8.9 | 6.5 | 6.3 | 6.4 |
|
3 ZINC53720402 |
|
5.9 | −9.2 | 6.7 | 6.3 | 6.3 |
|
4 ZINC5729284 |

|
5.8 | −9.2 | 6.7 | 6.2 | 6.5 |
|
5 ZINC000053720401 |

|
5.8 | −9.1 | 6.7 | 6.2 | — |
|
6 ZINC000000000012 |

|
6.1 | −8.7 | 6.4 | 6.2 | — |
|
7 ZINC000005008967 |
|
5.9 | −8.9 | 6.5 | 6.2 | — |
|
8 MolPort-003-757-821 |
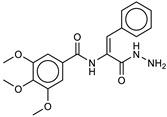
|
6.1 | −8.6 | 6.3 | 6.2 | — |
|
9 MolPort-002-518-389 |
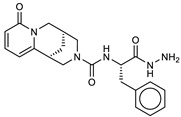
|
5.8 | −9.0 | 6.6 | 6.2 | — |
|
10 SN00068206 |
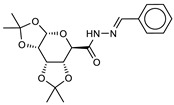
|
6.7 | −9.1 | 5.7 | 6.2 | — |
