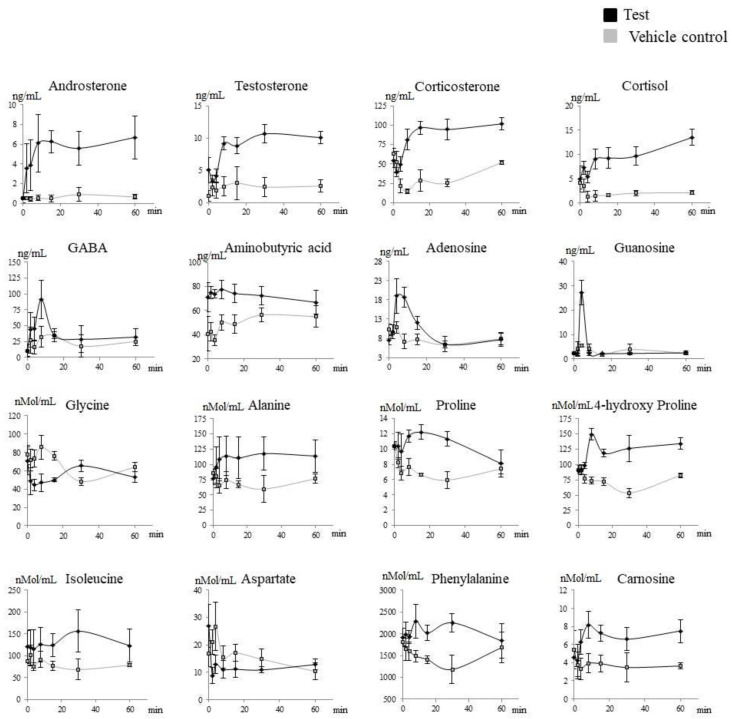
Figure 4.
Targeted metabolites that significantly changed after Prostanit administration. Treated (black) versus vehicle control (gray) groups. X-axis, time after the drug administration. Y-axis, the content of the appropriate metabolite in rabbit plasma. The assessment of the areas under the curve in treated and vehicle control groups using the Shapiro–Wilk test with the consequent discrimination of those significantly different using the Student t-test or equivalent non-parametric Mann–Whitney U test (in accordance with their distribution).

