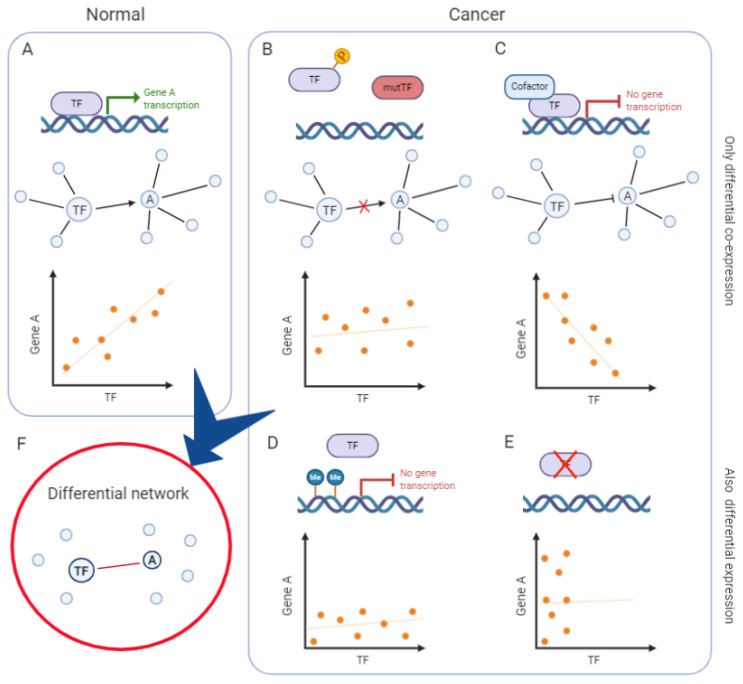
Figure 2.
Mechanisms underlying differential co-expression and their impact on transcripts’ correlation. Example of a simplified network in normal tissue (A) and in cancer (B–E), whose comparison leads to defining a differential network (F). (A) Example of a simplified co-expression network in normal tissue, with a transcription factor (TF) activating its target, gene A. The TF and A are connected by an edge and their expression is positively correlated. (B) Post-translational modifications (e.g., phosphorylation) or mutations of the TF impede its binding to gene A promoter. Hence, the TF does not activate gene A expression: they are not transcriptionally correlated and therefore not linked in the co-expression network. (C) The presence of a cofactor alters the activity of the TF, that switches from acting as an activator to being a repressor of gene A expression. Hence, the TF and gene A are negatively correlated. In the network, they can be represented as having an inhibitory edge or as not being linked. (D) Epigenetic mechanisms (e.g., DNA methylation) inhibit the TF binding and gene A expression. The TF and gene A are not correlated and they are not linked in the co-expression network. (E) In the absence of TF expression, gene A expression does not depend on its regulatory activity. The TF and gene A are not correlated nor linked in the co-expression network. These regulatory mechanisms and others alter the relationships between the TF and gene A, changing their correlation at the transcriptional level. In some cases, one of the two genes is also differentially expressed (D,E), in other cases, only co-expression changes (B,C). Reconstructing the differential network between “normal” and “cancer” conditions, exemplified here, would lead to defining a network where only the TF and gene A are linked by an edge, indicating a decreased correlation in cancer (F).

