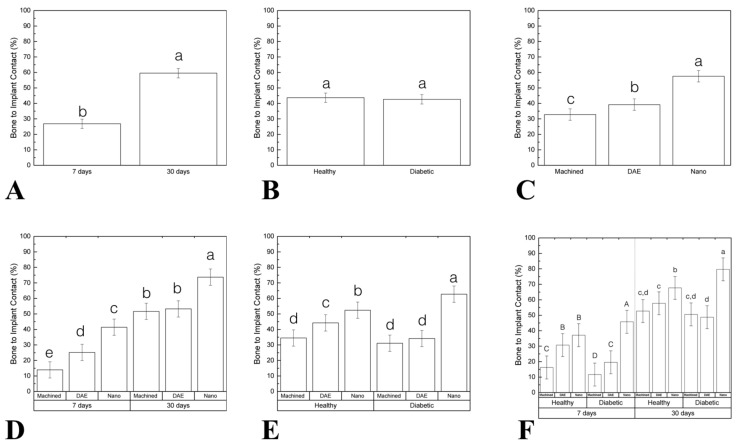
Figure 4.
(A–F) Graphs representing the percentage of bone to implant contact (%BIC) differently arranged as a function of study factors (mean and 95%CI). Significant difference was seen between 7 and 30 days in vivo (A). No statistically significant differences were found when comparing the healthy and diabetic group (data as function of systemic condition) (B). When implant surface was considered, NANO group exhibited higher %BIC relative to machined and DAE groups (data as a function of implant surface) (C). Data evaluation as a function of time and implant surface highlighted the superiority of the NANO group at 30 days compared to others (D). When %BIC was evaluated as a function of the systemic condition and surface, diabetic NANO group depicted a significant statistical difference (E). Evaluating all factors: time, systemic condition, and surface treatment the results revealed that NANO surface presented the best results in the diabetic group (7 and 30 days) (F). Identical letters indicate no significant difference among groups.

