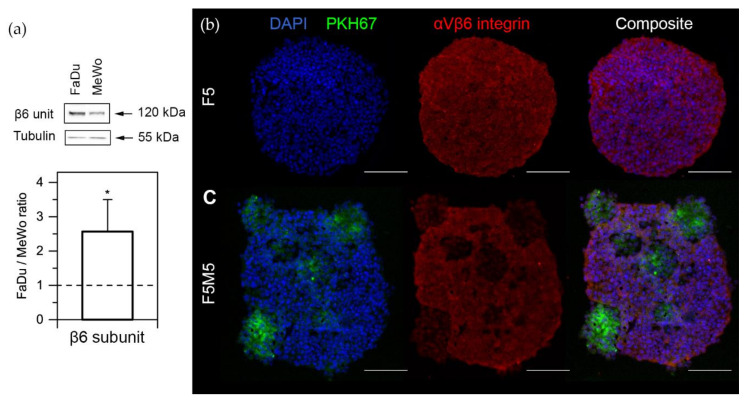
Figure 3.
Expression of integrins in FaDu and MeWo cells. (a) Western blot of β6 subunit expression in FaDu and MeWo cells and its quantification analysis. Data represent averages ± SD (n = 5; * p < 0.05, using the one-sample t-test (µ = 1)). (b,c) Typical fluorescence microscopy images of (b) F5 and (c) F5M5 spheroids cryosections, stained with antibody against αvβ6 integrins and DAPI. MeWo cells were pre-stained with PKH67 green membrane dye. Scale bar—100 μm.

