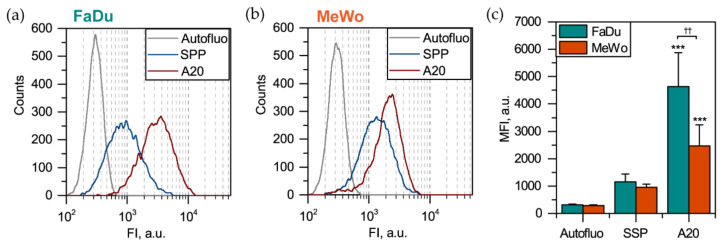
Figure 4.
Uptake of QDs in 2D monolayer FaDu and MeWo cells. Typical cytometry distribution histograms of (a) FaDu and (b) MeWo monolayer cells 3 h post-incubation with 50 nM of QDs. (c) Mean fluorescence intensity (MFI) of FaDu (cyan bars) and MeWo (orange bars) cells 3 h post-incubation with QDs (n = 6–7; *** p < 0.001 compared to autofluorescence, using ANOVA; †† p < 0.01, using two-sample t-test).

