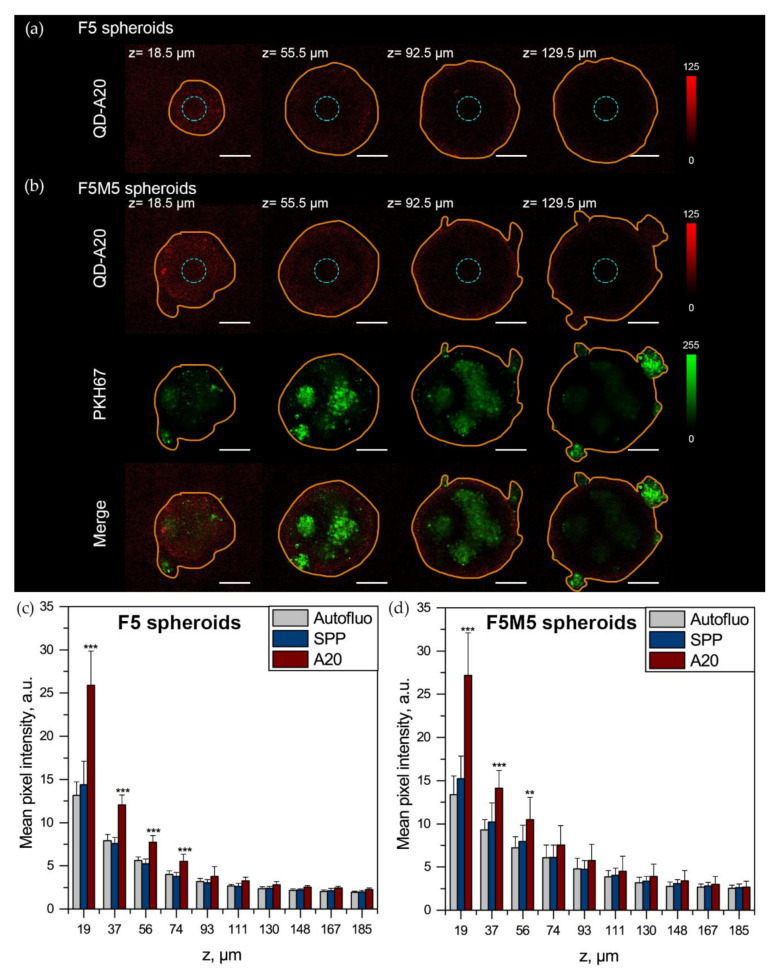
Figure 6.
3D Fluorescence imaging of QD-loaded head and neck squamous cell carcinoma (HNSCC) spheroids. 3D confocal microscopy of QD-A20 (red color, λem = 730–800 nm) distribution in different optical sections of (a) F5 and (b) F5M5 spheroids, incubated for 3 h with 50 nM of QDs. MeWo cells were pre-stained with PKH67 membrane dye (green color, λem = 530–600 nm). The orange line displays the contour of spheroid. The mean pixel intensity of the central region (blue circles) of (c) F5 and (d) F5M5 spheroids 3 h post-incubation with 50 nM of QDs as a function of the depth (z) of optical section. Scale bar = 100 µm. Data represent mean ± SD (n = 3–7; ** p < 0.01; *** p < 0.001 compared to autofluorescence, using ANOVA).

