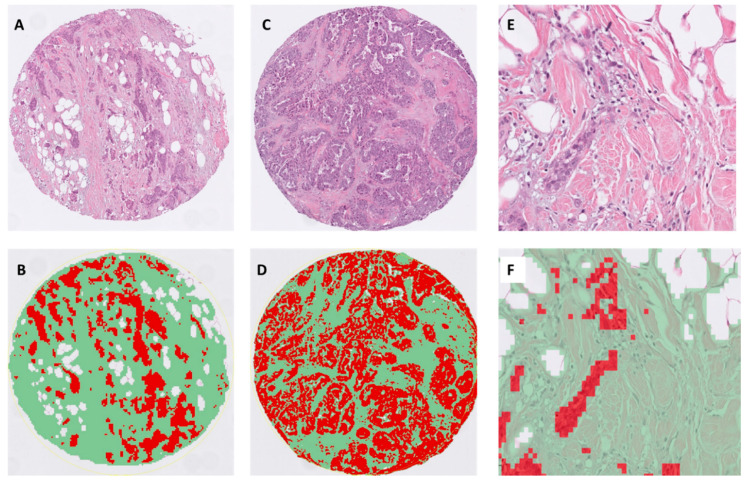
Figure 1.
Representative matched H&E and segmented images of tumour epithelium (red), stroma (green) and fat (white) using the pixel classifier algorithm in QuPath. The images display examples of invasive ductal carcinoma with (A,B): low tumour stroma ratio (TSR) (i.e., stroma high, TSR: 0.35, ×100), (C,D) intermediate TSR (roughly equivalent volumes of epithelium and stroma, TSR: 0.9, ×100); (E,F): high power of invasive ductal carcinoma with adjacent fat with a mild infiltrate of stromal tumour infiltrating lymphocytes (TILs) (×400).

