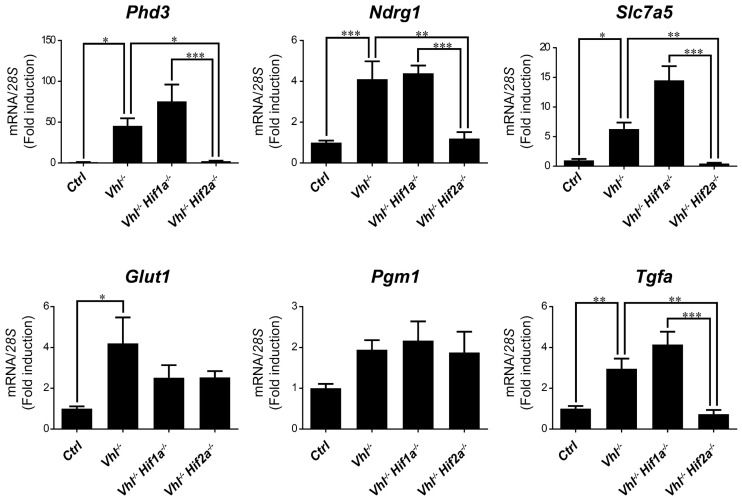
Figure 5.
Target gene selectivity for HIF1α or HIF2α in the lung of Vhl−/− mice. Relative Phd3, Ndrg1, Slc7a5, Glut1, Pgm1 and Tfga expression in the lung of Vhl−/− mice (n = 4–6), Vhl−/−Hif1a−/− mice (n = 5), Vhl−/−Hif2a−/− mice (n = 7) and the corresponding controls (n = 5–6). Data are shown as mean ± SEM. Statistical analysis was performed using one-way ANOVA followed by Tukey’s post hoc test. * p < 0.05, ** p < 0.01, and *** p < 0.001.

