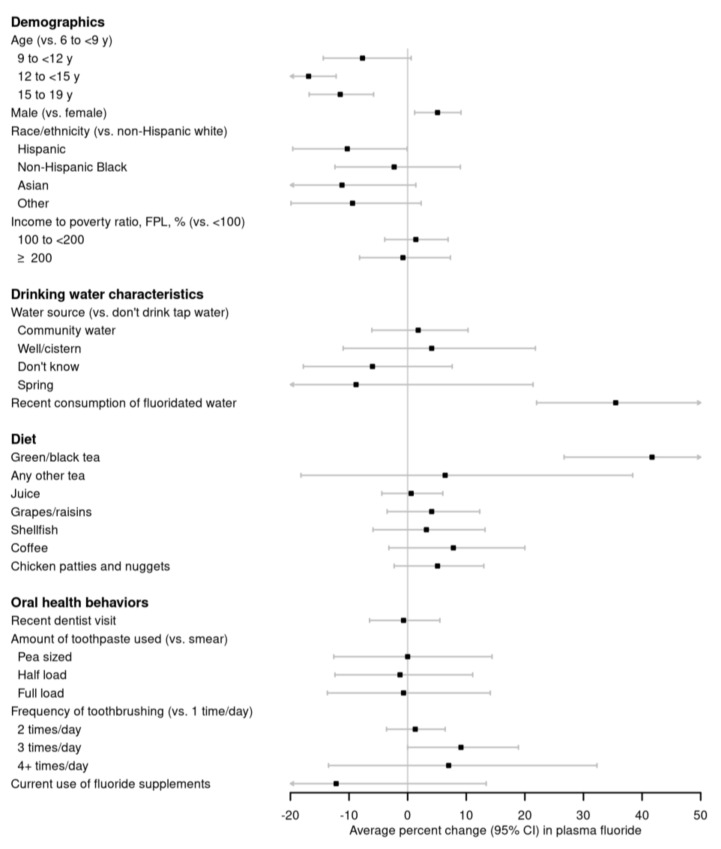
Figure 1.
Adjusted percent change (95% confidence interval) in plasma fluoride by demographics, drinking water characteristics, recent diet, and oral health behaviors in 3928 6–19-year-old National Health and Nutrition Examination Survey participants from 2013–2016. Adjusted for age, sex, race/ethnicity, and with mutual adjustment for consumption of fluoridated tap water, and recent green/black tea consumption. See Table A1 for effect estimates and 95% confidence intervals. Abbreviations: CI, confidence interval.

