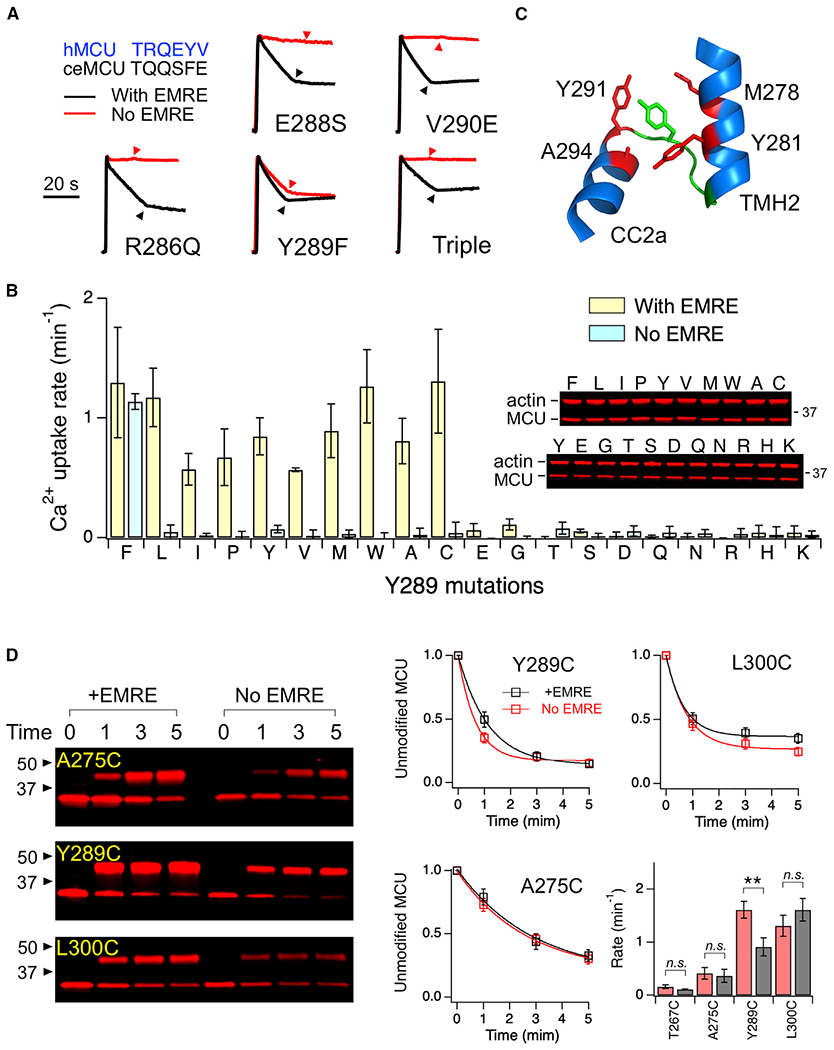
Figure 4. Critical Roles of Y289 in MCU Opening.

(A) Functional effects of JML mutations. Triple: R286Q/E288S/V290E. The JML sequences of hMCU and C. elegans (ce) MCU are compared (top left).
(B) A bar chart summarizing Ca2+ transport activity of Y289 mutants in the presence or absence of EMRE. Western blots show expression levels of these mutants. Mutants are arranged from most hydrophobic (left) to most hydrophilic (right) based on the M-F scale.
(C) Y289 (green) and surrounding residues (red).
(D) PEGM modification of substituted cysteines. The fraction of unmodified MCU, defined as the intensity of the lower band over the total intensity of upper and lower bands, was plotted as a function of time of PEGM treatment. The curves represent exponential fit, which yields a time constant used to calculate rate constants in the bar chart.
Data are presented as means ± SEMs. **p < 0.01; n.s., no significance (2-tailed t test).
See also Figures S2 and S3.
