
Figure 5. Critical Residues in EMRE-Dependent Opening.
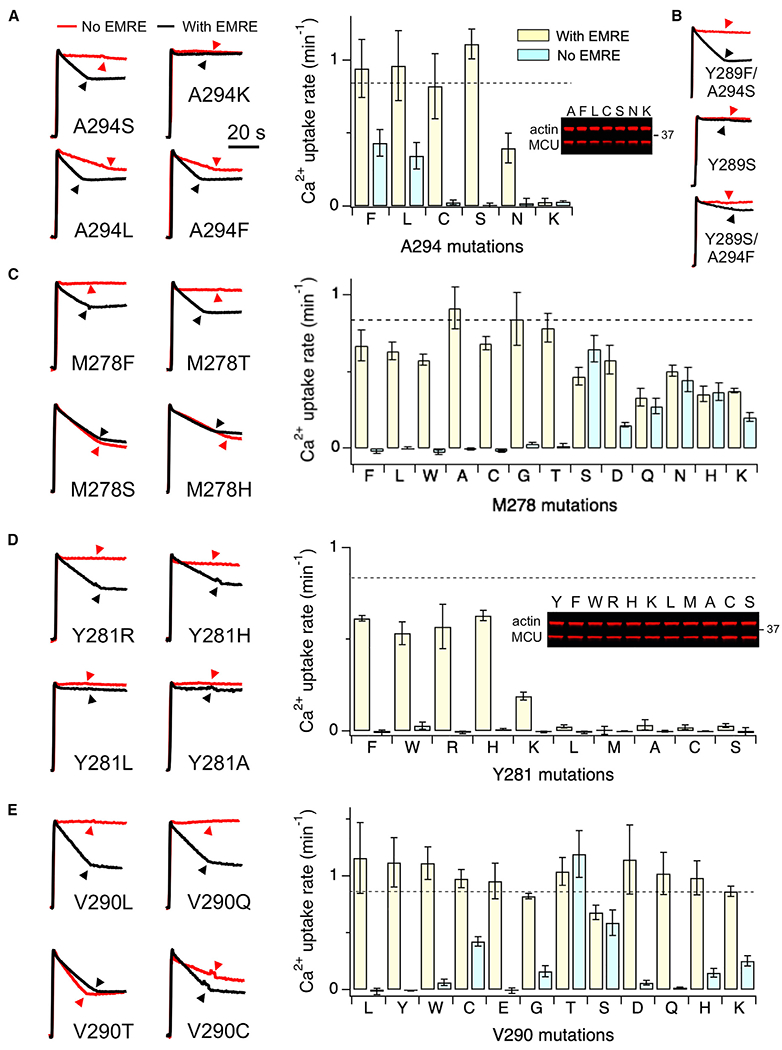
Mutational effects of various MCU residues were presented. M278, V290, and A294 mutants in the bar charts were arranged from the most hydrophobic to the most hydrophilic (left to right) according to the M-F scale. Dashed lines represent mean Ca2+ uptake rate of WT hMCU expressed in MCU-KO cells.
Data are presented as means ± SEMs.