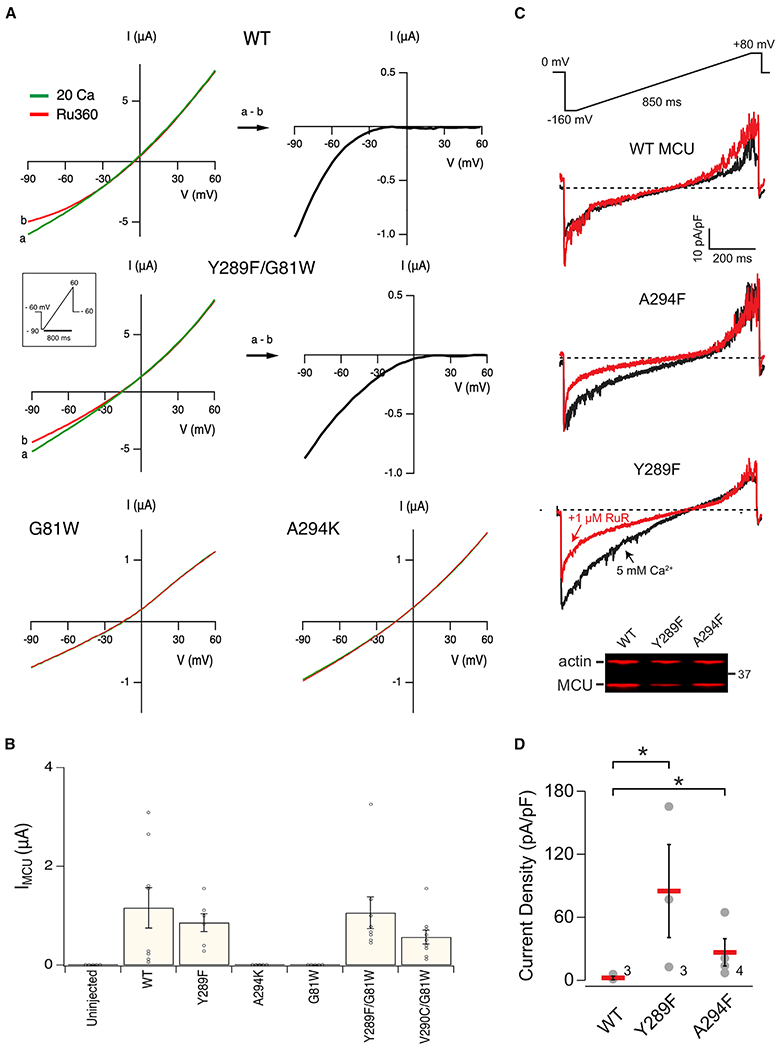
Figure 7. Electrical Recordings of Uniporter Mutants.

(A) I-V relations obtained from Xenopus oocytes expressing various hME constructs. Oocytes injected with EGTA were recorded in a 20-mM Ca2+ solution with (red) or without (green) Ru360. Subtracting currents before and after Ru360 addition reveals inwardly rectifying IMCU (black).
(B) The amplitude of IMCU at −90 mV.
(C) Exemplar Ca2+ current densities recorded using mitoplast patch clamp before (black) and after (red) adding 1 μM ruthenium red (RuR). All of the traces share the same voltage ramp protocol, and scale bars as indicated.
(D) Magnitudes of the RuR-sensitive current (difference in Ca2+ current density magnitude before and after RuR at −160 mV). Numbers on the graph indicate independent repeats.
Data are presented as means ± SEMs. *p < 0.05.
See also Figures S5 and S6.
