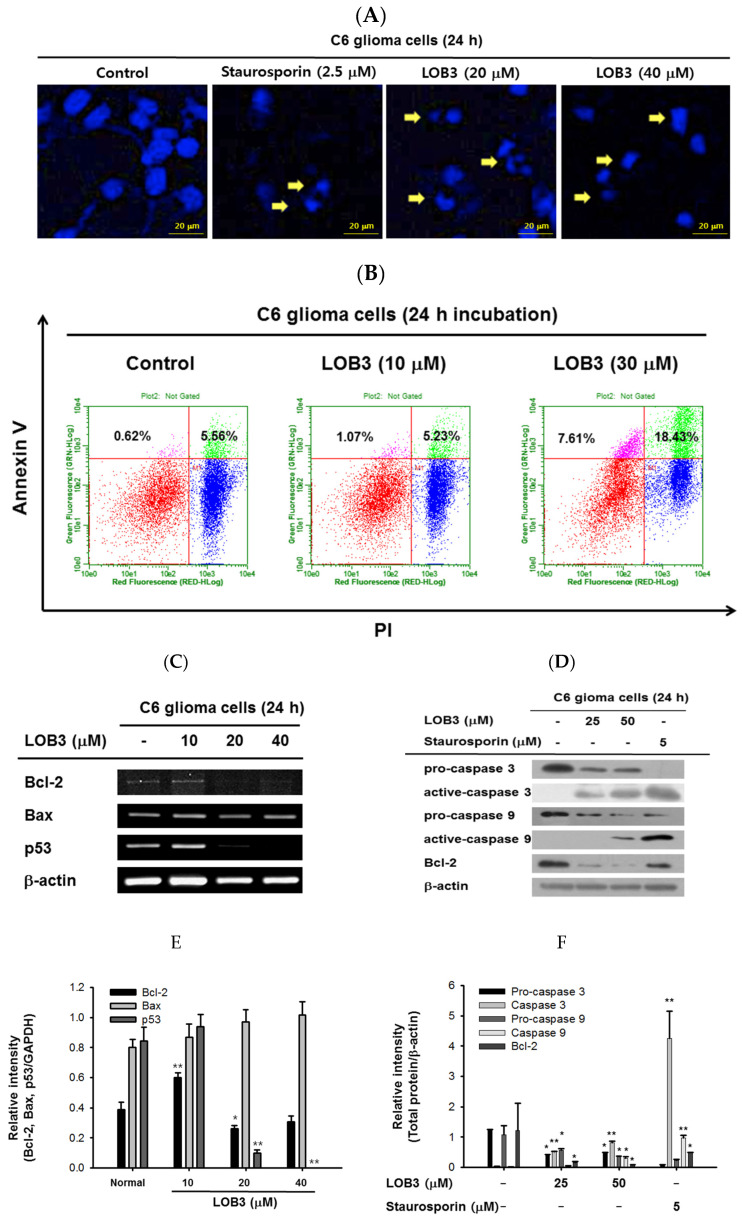
Figure 2.
Cytotoxic effect of LOB3 on C6 cells by apoptosis. (A) The nuclei of C6 cells treated with either staurosporine (2.5 μM) or LOB3 (20 and 30 μM) were stained with Hoechst 33342 and observed under a fluorescence microscope. Yellow arrows indicate nuclear shrinking and fragmentation. (B) C6 cells treated with the indicated doses of LOB3 for 24 h were stained with PI and annexin V-FITC, and the cell population was determined by flow cytometry analysis. (C) C6 cells were treated with the indicated doses of LOB3 for 24 h, and mRNA levels of Bcl-2, BAX, and p53 were analyzed by semiquantitative RT-PCR. (D) C6 cells were treated with either staurosporine (5 μM) or LOB3 (25 and 50 μM) for 24 h, and protein levels of pro-caspase-3, caspase-3, pro-caspase-9, and caspase-9 were determined by Western blot analysis. The data (E,F) are expressed as the means ± standard deviation (SD) of three experiments. Statistical significance was analyzed by the Mann-Whitney U test. Results (A,B). Data of band intensity (E,F) were measured and quantified using ImageJ. * p < 0.05 and ** p < 0.01 compared to the vehicle-treated controls.

