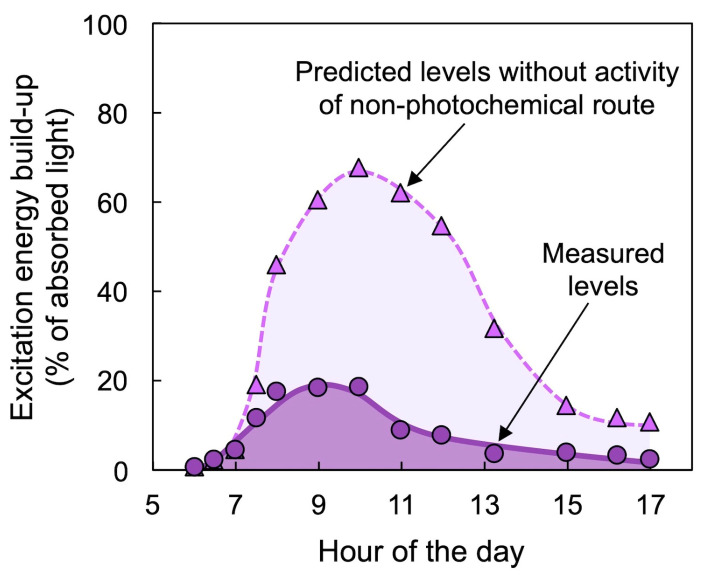
Figure 8.
Levels of measured (quantified from chlorophyll fluorescence as photosystem II reduction state; purple circles) and predicted (calculated for the absence of non-photochemical energy dissipation; purple triangles) build-up of excess excitation energy over the course of a day in the east-facing surface of a cactus (Nopalea cochenillifera) cladode. Data are from Demmig-Adams and Adams [19].

