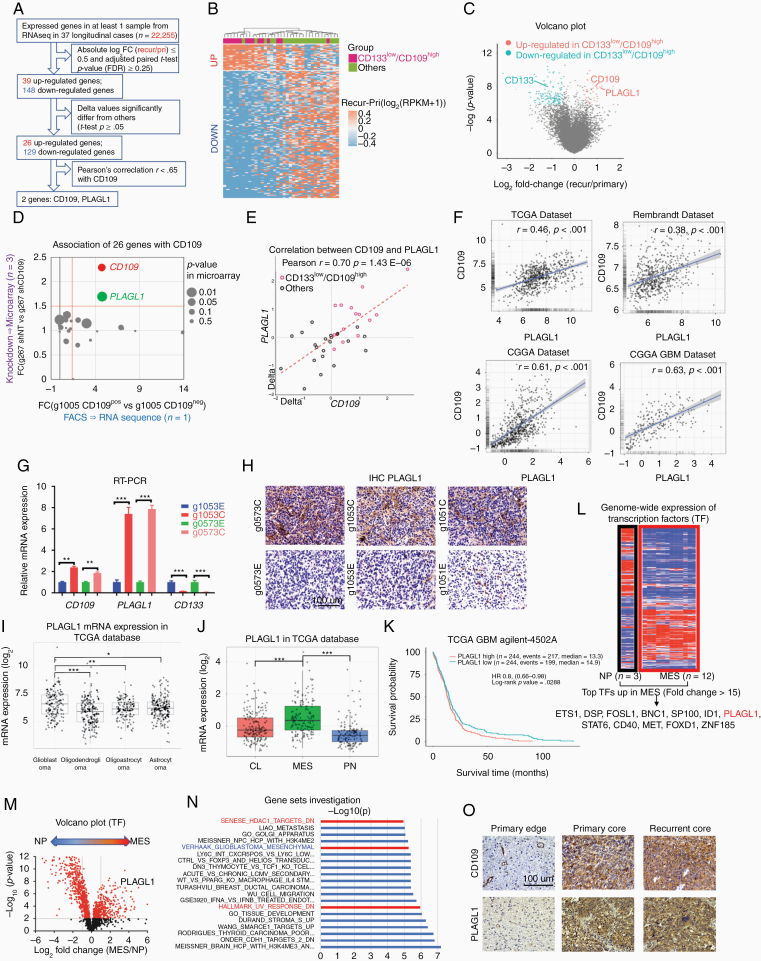
Figure 2.
Longitudinal RNA-seq analysis identifies the differential expression profile associated with ECT including PLAGL1 and CD109. (A) Schematic demonstration of the filtering procedure of PLAGL1 from 22,255 genes. (B) Heatmap depicting supervised hierarchical clusters of up- and down-regulated genes within recurrent glioblastomas of CD133low/CD109high and others. (C) Volcano plot of RNA-seq data comparing CD133low/CD109high and others. Red and blue dots refer to up- and down-regulated genes in CD133low/CD109high group, respectively. (D) Scatterplot comparing expression profiles of the 26 genes from RNA-seq analysis results within our tumor core-derived glioma sphere models; g1005 (n = 1) FACS-sorted into CD109 negative to positive cells and represented along the x-axis (left to right, respectively), while microarray relative expression of CD109 in g267 (n = 3) with shNT and shCD109 is represented along the y-axis (down- and up-ward, respectively). (E) Scatterplot displaying the linear correlation between CD109 and PLAGL1 expressions in the 37 longitudinal cases. Pearson correlation coefficient (r) = 0.70 and P = 1.43E−06. (F) Scatterplot displaying the linear correlation between CD109 and PLAGL1 expressions in 4 public databases (TCGA, Rembrandt, CGGA, and CGGA GBM), based on Pearson correlation test. (G) Bar graph displaying qRT-PCR results for the expression of CD109, PLAGL1, and CD133 within edge- and core-derived sphere culture models of 2 glioblastoma patients (g1053 and g0573). Data are means ± SD (n = 3). ***P < .001. (H) Representative images of immunohistochemistry (IHC) for PLAGL1 in mouse orthotopic xenografts with tumor core- (C) and edge(E)-derived glioma sphere models from 3 patients (g0573, g1053, and g1051). Scale bar 100 µm. (I) Boxplot diagram demonstrating PLAGL1 relative mRNA expression profiles from TCGA database across different gliomas subtypes. *P < .05, **P < .01, and ***P < .001. (J) Boxplot diagram comparing relative expression profiles of PLAGL1 among the 3 molecular subtypes (classical, mesenchymal [MES], and proneural) of glioblastoma within TCGA database. ***P < .001. (K) Kaplan–Meier survival curve of glioblastoma patients in the TCGA database. Patients were categorized into a “high” or “low” expression group based on the median PLAGL1 expression in the Agilent 4502 microarray. (L) Heatmap of displaying expression profiles of transcription factors (TFs) (n = 2,766) across 4 MES glioma sphere lines compared with the neural progenitor sphere line (NP) (n = 3 for each cell line). (M) Volcano plot comparing TF gene expressions (n = 2,766) across MES and NP lines, highlighting PLAGL1. (N) Upregulated pathways in recurrent glioblastomas in CD133low/CD109high group. (O) Representative IHC images for CD109 and PLAGL1 in primary edge and core, and recurrent core tumor tissues. Scale bar 100 µm.

