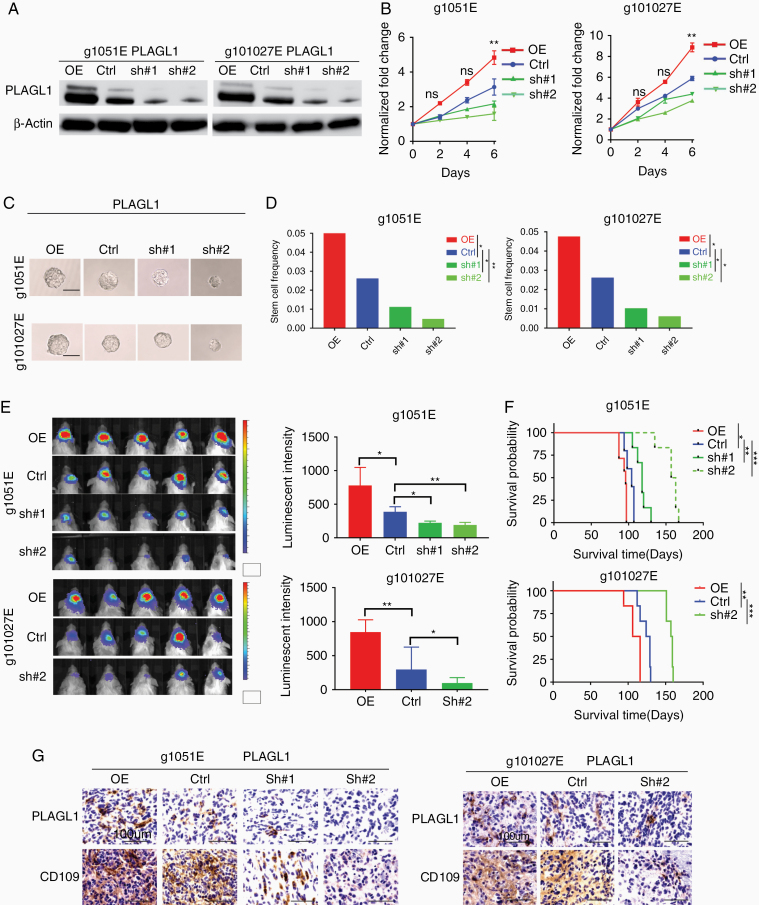
Figure 3.
PLAGL1 overexpression enhances, while its silencing diminished, glioblastoma growth in vivo, leading to prolong mouse survival in the edge-TIC models. (A) Western blotting of 2 patients’ tumor edge-derived glioma sphere lines (g1051E and g101027E) after transducing with overexpression vector (OE) or shRNA targeting PLAGL1 (sh#1 or sh#2) or a nontargeting control (Ctrl). (B) Line charts of in vitro growth of the indicated groups (**P < .01, n = 6, 1-way ANOVA). (C) Representative images of the indicated glioma sphere lines after genetic transduction. Scale bar 60 μm. (D) Bar graphs of the limiting dilution glioma sphere forming assay, depicting the relationship between PLAGL1 expression and clonal populations in the edge-derived glioma spheres (g1051E, g101027E) (*P < .05, **P < .01, ELDA analyses). (E) Bioluminescent images (left) and their quantifications (right) of orthotopic mouse xenografts established by injection of indicated g1051E and g101027E glioma sphere models (*P < .05 and **P < .01, n = 5, 1-way ANOVA). (F) Kaplan–Meier analysis of immunocompromised mice harboring intracranial tumors derived from g1051E or 101027E spheres transduced with either overexpressed PLAGL1 (n = 7), Ctrl (n = 5), shPLAGL1#1 (n = 6), or shPLAGL1#2 (n = 6). *P < .05, **P < .01, and ***P < .001. (G) IHC of indicated tumors in immunocompromised mice for CD109 and PLAGL1. Scale bar 100 µm.

