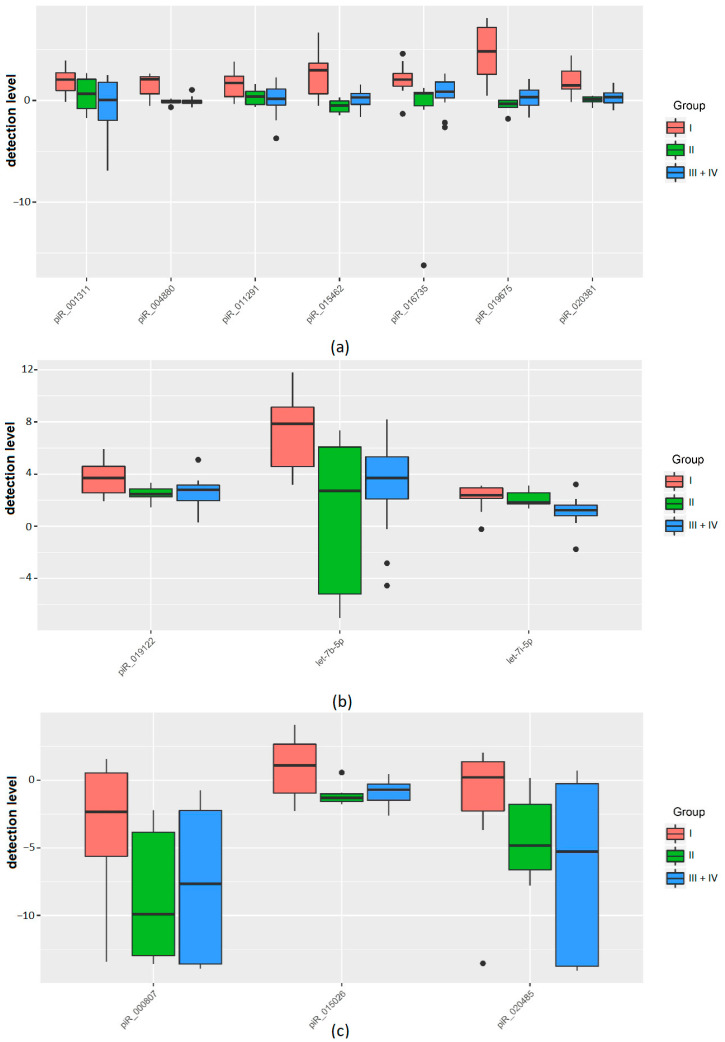
Figure 2.
Box plots of the qPCR data in the form of base 2 logarithm of the fold change in the detection level of sncRNA in the groups of samples I–IV relative to the reference sample. (a) An increase in the sncRNA detection level fold change in group I and a slight increase (less than 2 times) or no fold change in sncRNA detection level in groups II–IV. (b) An increase in the sncRNA detection level fold change in all groups by more than 2 times with more pronounced changes in group I. (c) A decrease in the sncRNA detection level fold change in the studied groups. The statistical significance of the differences between the groups is presented in Table 4.

