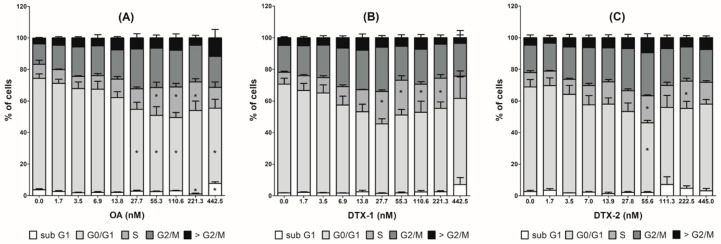
Figure 3.
Cell cycle progression in Caco-2 cells after 24 h exposure to phycotoxins. (A) okadaic acid (OA); (B) dinophysistoxin-1 (DTX-1); (C) dinophysistoxin-2 (DTX-2). The cells were classified in the different cell cycle phases using nuclear DAPI staining (>G2/M corresponds to polyploid cells). Values are presented as means ± SEM and expressed in relation to the total cell number. Four independent experiments were performed. *: significantly different from the vehicle control (p < 0.05).

