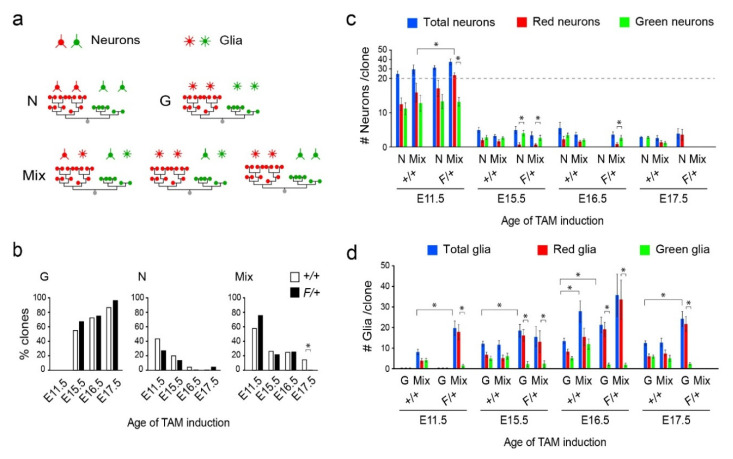
Figure 3.
Analysis of MADM clone types. (a) Classification of clones based on their neuronal and glial compositions. (b) Percentage of all clones containing G, N or Mix types across the different induction time points and genotypes (green and red MADM cells are combined). (c) Numbers of neurons in different clone types in +/+ and F/+ cortices at different induction times. Total numbers of neurons are broken down into their green and red sibling fractions as shown. The scales for Y-axis values are not the same for the 0–20 and 20–50 ranges in order to reveal the low values for neurons in E15.5–E17.5 induced clones. (d) Numbers of glia in different clone types in +/+ and F/+ cortices at different induction times. Total numbers of glia per clone are broken down into their green and red sibling fractions as shown. Data are mean ± sem. *, rank-sum test, p < 0.05.

