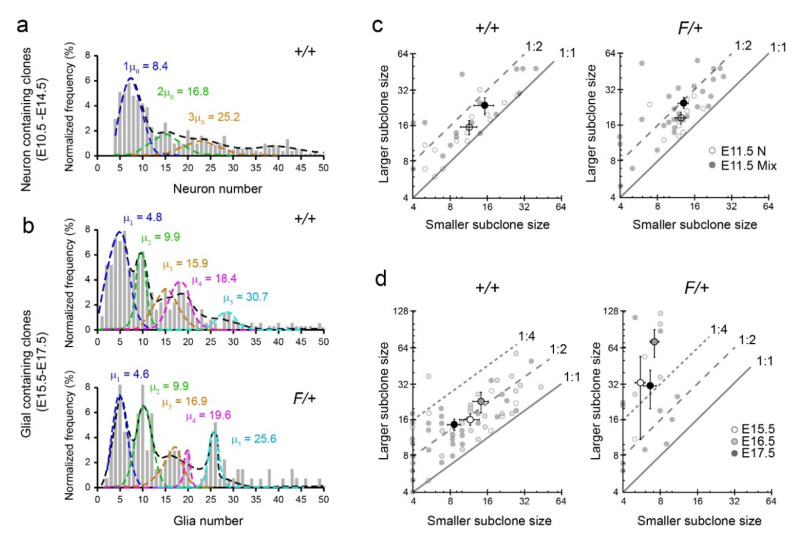
Figure 5.
Gliogenesis exhibits a stochastic pattern of clonal expansion in the cortex. (a) Gaussian curve fitting for analysis of size distribution of clones versus their normalized frequency for early neurogenic clones (E10.5–E14.5). Values for the histogram and Gaussian curves were extracted manually using the WebPlotDigitizer (https://automeris.io/WebPlotDigitizer/citation.html) from Gao et al. [1]. (b) Gaussian curve fitting for analysis of size distribution of clones versus their normalized frequency for gliogenic clones (E15.5–E17.5). (c) Scatterplot presenting the size (number of cells) of larger versus smaller sibling subclones of individual clones during the neurogenic period at E11.5 in +/+ and F/+ cortices. (d) Scatterplots presenting the size (number of cells) of larger versus smaller sibling subclones of individual clones during the gliogenic period in +/+ and F/+ cortices. White, black, and gray dots with error bars represent mean ± sem, faded dots indicate individual clones, and the slopes indicate ratio boundaries as indicated in both (c,d).

