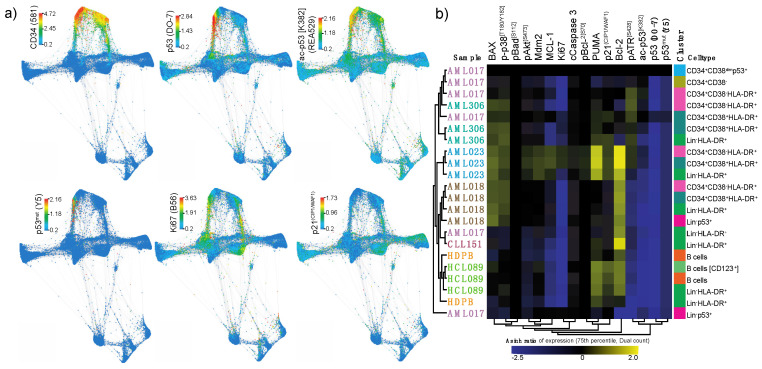
Figure 4.
p53 network in primary samples. (a) Force directed layout showing the single cell expression level (arcsinh transformed dual counts) of CD34 (581), p53 (DO-7), ac-p53 [K382] (REA529), p53mut (Y5), Ki67 (B56) and p21(CIP1/WAF1) (12D1). (b) Heatmap showing the relative expression level of intracellular signaling proteins in selected cell populations. Clusters are color-coded corresponding to the color of the cluster name in Figure 3a. Color scale indicates expression level (arcsinh ratio) relative to the CD34+CD38dimp53+ population in patient AML017 (top row).

