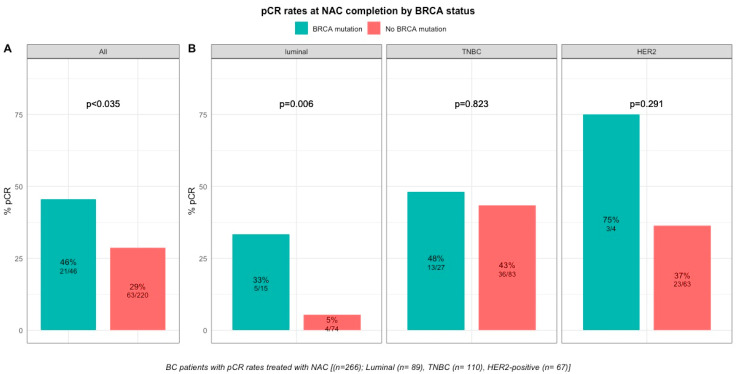
Figure 2.
Barplot of associations between response to treatment and BRCA status in whole population, and by breast cancer subtype. (A), among the whole population (All (n = 266), BRCA mutation (n = 46), BRCA wild-type (n = 220)). (B), by BC subtype (Luminal (n = 89), BRCA mutation (n = 15), BRCA wild-type (n = 74); TNBC (n = 110), BRCA mutation (n = 27), BRCA wild-type (n = 83); HER2 (n = 67), BRCA mutation (n = 4), BRCA wild-type (n = 63)).

