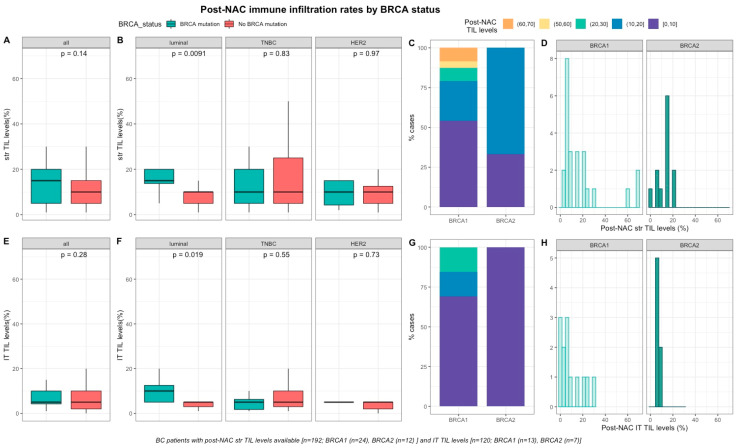
Figure 3.
Associations between post-NAC TILs and BRCA status in whole population, and after stratification by breast cancer subtype. Bottom and top bars of the boxplots represent the first and Table 1. 5 times the interquartile range. (A) stromal lymphocytes among the whole population (All (n = 192), BRCA mutation (n = 36), BRCA wild-type (n = 156)). (B) stromal lymphocytes in each BC subtype (Luminal (n = 52), BRCA mutation (n = 8), BRCA wild-type (n = 44); TNBC (n = 97), BRCA mutation (n = 24), BRCA wild-type (n = 73); HER2 (n = 43), BRCA mutation (n = 4), BRCA wild-type (n = 39)). (C) Percentage of tumor according to post-NAC stromal lymphocytes levels binned by 10% increment in patients with BRCA-deficient (BRCA1 (n = 24), BRCA2 (n = 12)). (D) distribution of post-NAC stromal lymphocytes by gene mutations (histogram plot) in patients with BRCA-deficient (BRCA1 (n = 24), BRCA2 (n = 12)). (E) intratumoral lymphocytes among the whole population (All (n = 120), BRCA mutation (n = 20), BRCA wild type (n = 100)). (F) intratumoral lymphocytes in each BC subtype (Luminal (n = 44), BRCA mutation (n = 7), BRCA wild-type (n = 37); TNBC (n = 50), BRCA mutation (n = 12), BRCA wild-type (n = 38); HER2 (n = 26), BRCA mutation (n = 1), BRCA wild-type (n = 25)). (G) percentage of tumor according to post-NAC intratumoral lymphocytes levels binned by 10% increment in patients with BRCA-deficient (BRCA1 (n = 13), BRCA2 (n = 7)). (H) distribution of post-NAC intratumoral lymphocytes by gene mutations (histogram plot) in patients with BRCA-deficient (BRCA1 (n = 13), BRCA2 (n = 7)).

