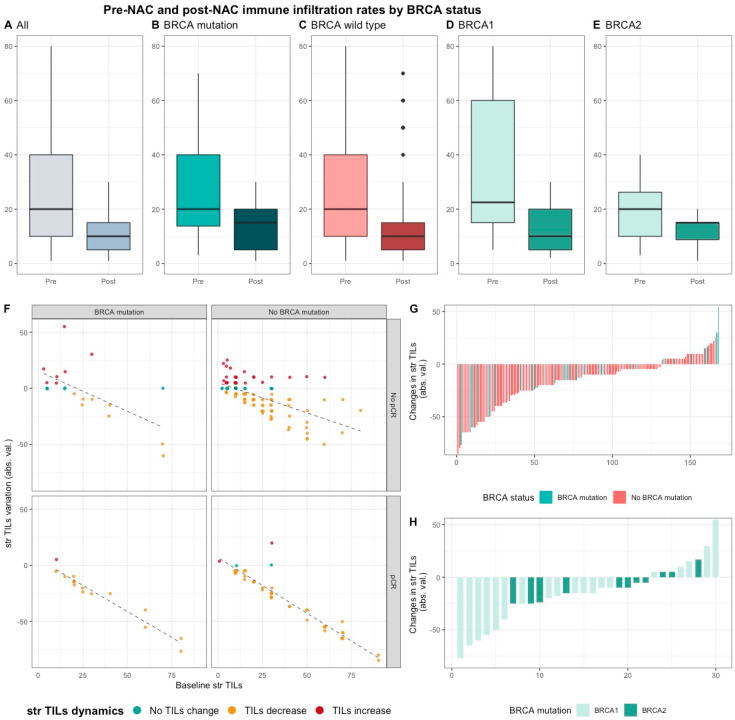
Figure 4.
Pre-NAC and post-NAC stromal immune infiltration rates in the whole population and by BRCA status. (A–E) bar plots of str TIL levels before and after NAC in the whole population and in BRCA pathogenic variant. Bottom and top bars of the boxplots represent the first and third quartiles, respectively, the medium bar is the median, and whiskers extend to 1.5 times the interquartile range. (All (n = 192); BRCA mutation (n = 36), BRCA wild-type (n = 156); BRCA1 (n = 24), BRCA2 (12)). (F) variation of str TIL levels according to the pre-NAC str TIL levels binned by BRCA status and response to chemotherapy. Points represent the difference between pre- and post-NAC paired TIL levels values of a given patient and are colored according to TIL variation category (TIL level decrease: yellow/no change: green/increase: red) (All (n = 191), BRCA mutation (n = 36), BRCA wild-type (n = 155)). (G–H) waterfall plot representing the variation of TIL levels according to BRCA-deficient (BRCA1-deficient, BRCA2-deficient); each bar represents one sample, and samples are ranked by increasing order of TIL level change. Paired samples for which no change was observed have been removed from the graph. (All (n = 191), BRCA mutation [(n = 36), BRCA1, n = 24; BRCA2 = 12)], BRCA wild-type (n = 155)).

