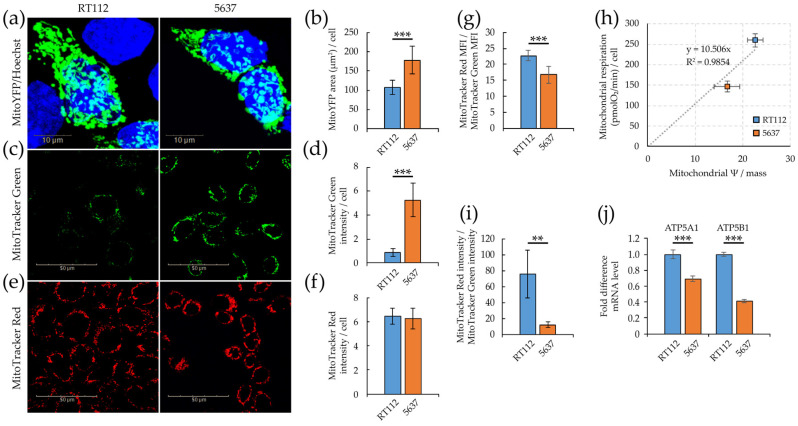
Figure 4.
Mitochondrial efficiency of RT112 and 5637 cells. (a) Confocal imaging of fixed cells transiently transfected for the expression of the mitochondrial-specific MitoYFP protein (green), stained with Hoechst 33342 dye labeling nuclei (blue). (b) Mitochondrial area per cell quantified as the ratio of green (MitoYFP) fluorescent area to blue Hoechst-positive objects (nuclei) in manually selected 30-40 ROIs containing green positive cells. (c) Confocal imaging of living cells stained with mitochondrion-selective MitoTracker™ Green FM (green). (d) Mitochondrial mass per cell calculated as the ratio of MitoTracker™ green fluorescence intensity to blue Hoechst-positive objects (nuclei). (e) Confocal imaging of living cells stained with the potentiometric mitochondrion-selective MitoTracker™ Red CMXRos dye (red). (f) Mitochondrial membrane potential per cell calculated as the ratio of MitoTracker™ Red CMXRos fluorescence intensity to blue Hoechst-positive objects (nuclei). (g) Mitochondrial membrane potential per mitochondrial mass unit calculated as the ratio of the median fluorescence intensity of MitoTracker Red CMXRos per cell and the median fluorescence intensity of MitoTracker Green per cell by flow cytometry analysis. (h) Correlation between basal respiration OCR and mitochondrial membrane potential per mitochondrial mass unit measured by flow cytometry. (i) Mitochondrial membrane potential per mitochondrial mass unit calculated by quantitative imaging as the ratio of the Mitotracker Red and Green’s fluorescence intensity per cell. (j) mRNA level by qRT-PCR of ATP5A1 and ATP5B1 genes normalized to the house-keeping HPRT-1 gene level. Quantitative imaging analysis was performed with Harmony software (b,d,f,i). All results are the mean of at least three experimental replicates. Statistical test: t-test, ** for p < 0.01; *** for p < 0.001.

