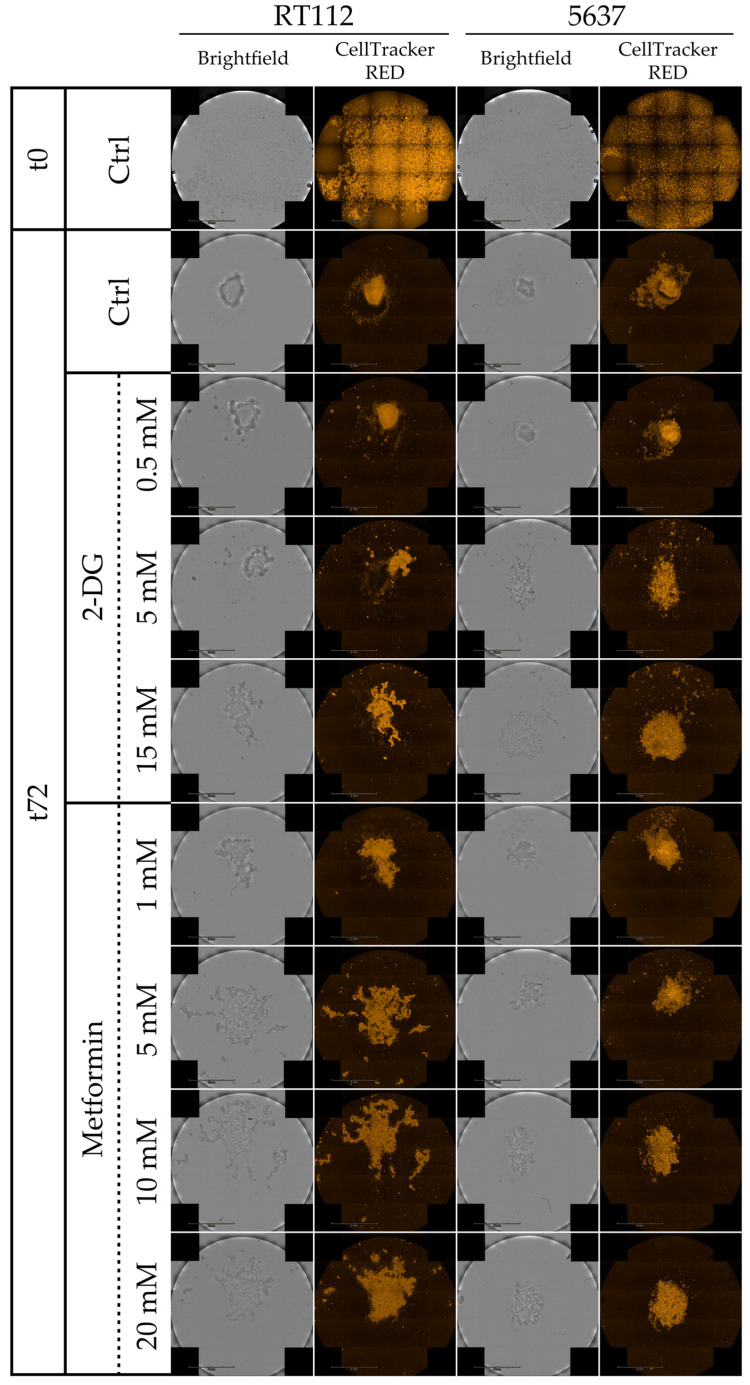
Figure 8.
Spheroid formation under pharmacological treatment of RT112 and 5637 cells. Representative images from brightfield and fluorescence microscopy (orange: CellTracker™ Red CMTPX Dye) acquired with Operetta CLS™ at 0 h and 72 h of cells grown in cell repellent 96-well plate under treatment with increasing concentration of 2-Deoxy-D-glucose (2-DG) (0, 0.5, 5, 15 mM) and metformin (0, 1, 5, 10, 20 mM).

