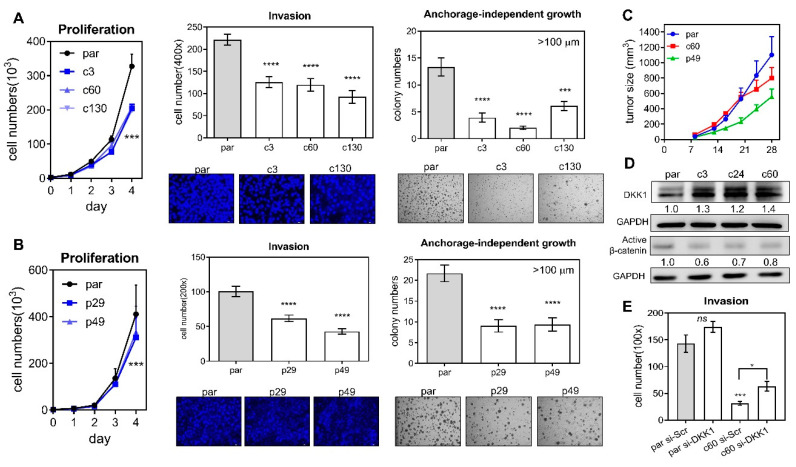
Figure 2.
Phenotypic analysis of the deleted subclones. (A,B) Deletion of the miR-371/372/373 cluster and the miR-371/372/373 promoter, respectively. Lt, proliferation; Middle, invasion; Rt, anchorage-independent growth. Upper, quantification; Lower, representative fields. Invasion, ×100; anchorage-independent growth, ×50. (C) Subcutaneous xenografts in nude mice. Four or eight tumors in each group. (D) Western blot analysis of DKK1 and β-catenin expression in parental cells and the cluster deleted subclones. (E) Invasion assay of parental cells and the c60 subclone after treatment of 60 mM si-Scr or si-DKK1 oligonucleotides for 48 h. par, parental cell. *, p < 0.05; ***, p < 0.001; ****, p < 0.0001.

