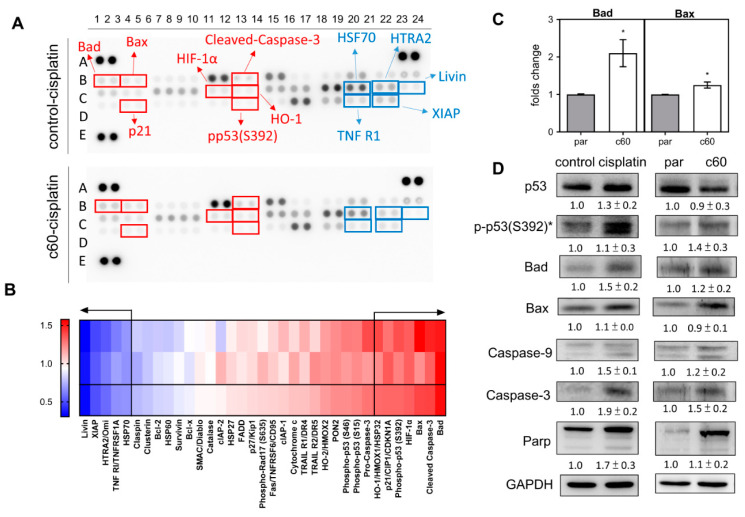
Figure 4.
Analysis of various apoptosis associated proteins. (A) The Apoptosis Protein Array. Red rectangles mark the upregulated proteins, while the blue rectangles mark the downregulated proteins. (B) Heatmap of the protein changes in the c60 subclone relative to parental cells following cisplatin treatment. At the bottom are the average of the spot duplicates presented above. Proteins showing a change in abundance that exceeds 30% are separated from the others by arrows. Lt, gradient bar. (C) qPCR analysis of Bad and Bax mRNA expression. (D) Western blot analysis of p53, pp53 (s392), Bad, Bax, Caspase-9, Caspase-3, and Parp expression. Comparisons are made between the control cells and the cisplatin treated cells, and between the parental cells and the c60 subclone cells. Data shown are means ± SE with at least triplicate analysis. *, normalized against the p53 level. par, parental cells.

