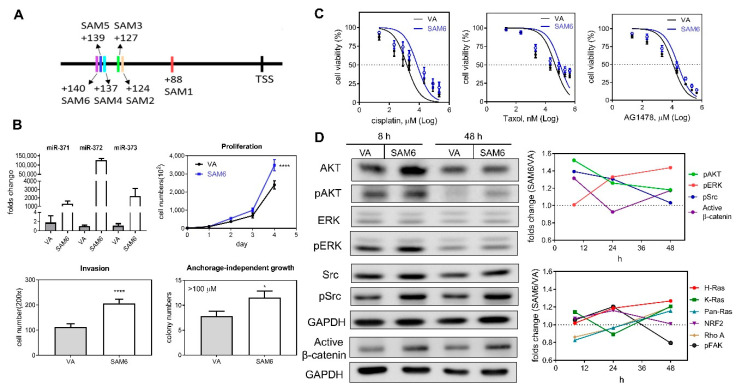
Figure 5.
Transactivation of the miR-371/372/373 promoter in SAS cells using the CRIPR/dCas9 synergistic activation mediator (SAM) system. (A) Schematic diagram illustrating the strategy used. The six oligonucleotide targeting sites for SAM functioning are marked as SAM1–SAM6. (B–D) Comparisons across cells transfected with the SAM6 construct and vector alone (VA). (B) Lt Upper, Expression of miR-371/372/373 members. Others, assays measuring proliferation, invasion, and anchorage-independent growth. *, p < 0.05; ****, p < 0.0001. (C) Dose-response plots for cisplatin, taxol, and AG1478. Cells viability was measured by the MTT assay. Doses of drugs are Log10 transformed. (D) Western blot analysis. Lt, A representative analysis illustrating the changes in AKT, pAKT, ERK, pERK, Src, pSrc, and active-β-catenin expression at 8 h and 48 h following transfection. Rt, quantification of the signals over the time course from using at least duplicate analysis. Upper, pAKT, pERK, pSrc, and active-β-catenin. Lower, Ras families, NRF2, Rho A, and pFAK. Data shown are mean values from at least duplicate analysis. Representative analysis is described in Figure 5S.

