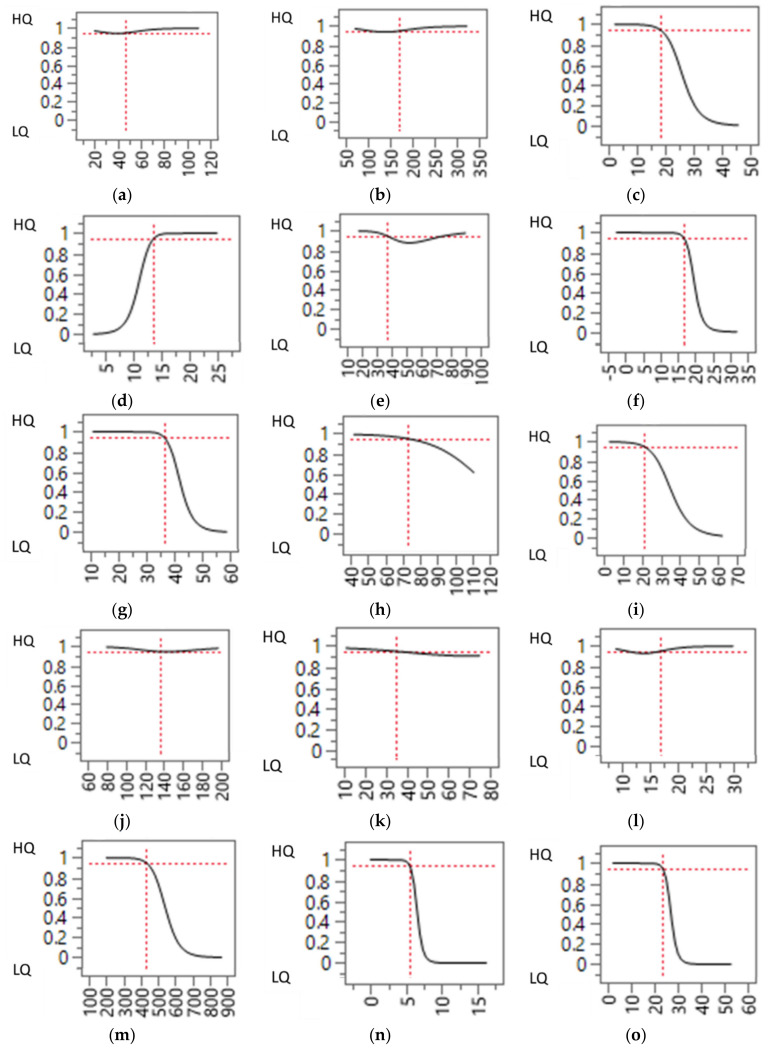
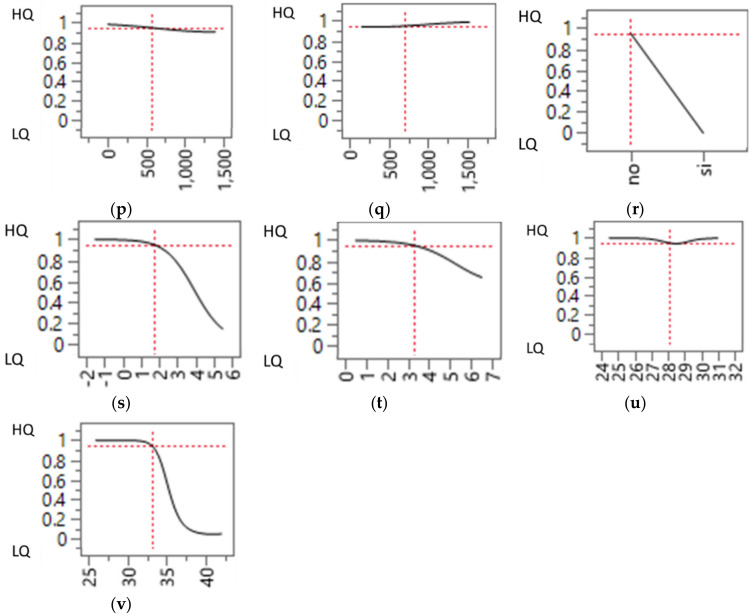
Figure 2.
Profile graphs of the neural network model for all the pre-slaughter variables presented in Table 2. For each graph, the name of the variable plotted on the x-axis is indicated below the figure. (HQ = High quality cluster; LQ = Low quality cluster). Variable names highlighted in bold character indicate statistically significant differences (p < 0.05) between clusters, as presented in Table 2. (a) Loading duration, min. (b) Pigs loaded per hour, n. (c) Irregular behaviors at loading, %. (d) Waiting time at the farm, min. (e) Journey duration, min. (f) Ambient temperature, °C. (g) Distance traveled, km. (h) Average vehicle speed, km/h. (i) Waiting time at slaughterhouse, min. (j) Total journey duration, min. (k) Total waiting time on the truck, min. (l) Unloading duration, min. (m) Pigs unloaded per hour, n. (n) Irregular behaviors at unloading, %. (o) Total irregular behaviors. (p) Lairage duration, min. (q) Transport + lairage duration, min. (r) Stable (unmixed) groups, odds ratio. (s) On-departure (at farm) score, pts. (t) Transport score, pts. (u) Slaughter score, pts. (v) TSWI, pts.


